Hurst Exponent Adaptive Filter (HEAF) [PhenLabs]📊 PhenLabs - Hurst Exponent Adaptive Filter (HEAF)
Version: PineScript™ v6
📌 Description
The Hurst Exponent Adaptive Filter (HEAF) is an advanced Pine Script indicator designed to dynamically adjust moving average calculations based on real time market regimes detected through the Hurst Exponent. The intention behind the creation of this indicator was not a buy/sell indicator but rather a tool to help sharpen traders ability to distinguish regimes in the market mathematically rather than guessing. By analyzing price persistence, it identifies whether the market is trending, mean-reverting, or exhibiting random walk behavior, automatically adapting the MA length to provide more responsive alerts in volatile conditions and smoother outputs in stable ones. This helps traders avoid false signals in choppy markets and capitalize on strong trends, making it ideal for adaptive trading strategies across various timeframes and assets.
Unlike traditional moving averages, HEAF incorporates fractal dimension analysis via the Hurst Exponent to create a self-tuning filter that evolves with market conditions. Traders benefit from visual cues like color coded regimes, adaptive bands for volatility channels, and an information panel that suggests appropriate strategies, enhancing decision making without constant manual adjustments by the user.
🚀 Points of Innovation
Dynamic MA length adjustment using Hurst Exponent for regime-aware filtering, reducing lag in trends and noise in ranges.
Integrated market regime classification (trending, mean-reverting, random) with visual and alert-based notifications.
Customizable color themes and adaptive bands that incorporate ATR for volatility-adjusted channels.
Built-in information panel providing real-time strategy recommendations based on detected regimes.
Power sensitivity parameter to fine-tune adaptation aggressiveness, allowing personalization for different trading styles.
Support for multiple MA types (EMA, SMA, WMA) within an adaptive framework.
🔧 Core Components
Hurst Exponent Calculation: Computes the fractal dimension of price series over a user-defined lookback to detect market persistence or anti-persistence.
Adaptive Length Mechanism: Maps Hurst values to MA lengths between minimum and maximum bounds, using a power function for sensitivity control.
Moving Average Engine: Applies the chosen MA type (EMA, SMA, or WMA) to the adaptive length for the core filter line.
Adaptive Bands: Creates upper and lower channels using ATR multiplied by a band factor, scaled to the current adaptive length.
Regime Detection: Classifies market state with thresholds (e.g., >0.55 for trending) and triggers alerts on regime changes.
Visualization System: Includes gradient fills, regime-colored MA lines, and an info panel for at-a-glance insights.
🔥 Key Features
Regime-Adaptive Filtering: Automatically shortens MA in mean-reverting markets for quick responses and lengthens it in trends for smoother signals, helping traders stay aligned with market dynamics.
Custom Alerts: Notifies on regime shifts and band breakouts, enabling timely strategy adjustments like switching to trend-following in bullish regimes.
Visual Enhancements: Color-coded MA lines, gradient band fills, and an optional info panel that displays market state and trading tips, improving chart readability.
Flexible Settings: Adjustable lookback, min/max lengths, sensitivity power, MA type, and themes to suit various assets and timeframes.
Band Breakout Signals: Highlights potential overbought/oversold conditions via ATR-based channels, useful for entry/exit timing.
🎨 Visualization
Main Adaptive MA Line: Plotted with regime-based colors (e.g., green for trending) to visually indicate market state and filter position relative to price.
Adaptive Bands: Upper and lower lines with gradient fills between them, showing volatility channels that widen in random regimes and tighten in trends.
Price vs. MA Fills: Color-coded areas between price and MA (e.g., bullish green above MA in trending modes) for quick trend strength assessment.
Information Panel: Top-right table displaying current regime (e.g., "Trending Market") and strategy suggestions like "Follow trends" or "Trade ranges."
📖 Usage Guidelines
Core Settings
Hurst Lookback Period
Default: 100
Range: 20-500
Description: Sets the period for Hurst Exponent calculation; longer values provide more stable regime detection but may lag, while shorter ones are more responsive to recent changes.
Minimum MA Length
Default: 10
Range: 5-50
Description: Defines the shortest possible adaptive MA length, ideal for fast responses in mean-reverting conditions.
Maximum MA Length
Default: 200
Range: 50-500
Description: Sets the longest adaptive MA length for smoothing in strong trends; adjust based on asset volatility.
Sensitivity Power
Default: 2.0
Range: 1.0-5.0
Description: Controls how aggressively the length adapts to Hurst changes; higher values make it more sensitive to regime shifts.
MA Type
Default: EMA
Options: EMA, SMA, WMA
Description: Chooses the moving average calculation method; EMA is more responsive, while SMA/WMA offer different weighting.
🖼️ Visual Settings
Show Adaptive Bands
Default: True
Description: Toggles visibility of upper/lower bands for volatility channels.
Band Multiplier
Default: 1.5
Range: 0.5-3.0
Description: Scales band width using ATR; higher values create wider channels for conservative signals.
Show Information Panel
Default: True
Description: Displays regime info and strategy tips in a top-right panel.
MA Line Width
Default: 2
Range: 1-5
Description: Adjusts thickness of the main MA line for better visibility.
Color Theme
Default: Blue
Options: Blue, Classic, Dark Purple, Vibrant
Description: Selects color scheme for MA, bands, and fills to match user preferences.
🚨 Alert Settings
Enable Alerts
Default: True
Description: Activates notifications for regime changes and band breakouts.
✅ Best Use Cases
Trend-Following Strategies: In detected trending regimes, use the adaptive MA as a trailing stop or entry filter for momentum trades.
Range Trading: During mean-reverting periods, monitor band breakouts for buying dips or selling rallies within channels.
Risk Management in Random Markets: Reduce exposure when random walk is detected, using tight stops suggested in the info panel.
Multi-Timeframe Analysis: Apply on higher timeframes for regime confirmation, then drill down to lower ones for entries.
Volatility-Based Entries: Use upper/lower band crossovers as signals in adaptive channels for overbought/oversold trades.
⚠️ Limitations
Lagging in Transitions: Regime detection may delay during rapid market shifts, requiring confirmation from other tools.
Not a Standalone System: Best used in conjunction with other indicators; random regimes can lead to whipsaws if traded aggressively.
Parameter Sensitivity: Optimal settings vary by asset and timeframe, necessitating backtesting.
💡 What Makes This Unique
Hurst-Driven Adaptation: Unlike static MAs, it uses fractal analysis to self-tune, providing regime-specific filtering that's rare in standard indicators.
Integrated Strategy Guidance: The info panel offers actionable tips tied to regimes, bridging analysis and execution.
Multi-Regime Visualization: Combines adaptive bands, colored fills, and alerts in one tool for comprehensive market state awareness.
🔬 How It Works
Hurst Exponent Computation:
Calculates log returns over the lookback period to derive the rescaled range (R/S) ratio.
Normalizes to a 0-1 value, where >0.55 indicates trending, <0.45 mean-reverting, and in-between random.
Length Adaptation:
Maps normalized Hurst to an MA length via a power function, clamping between min and max.
Applies the selected MA type to close prices using this dynamic length.
Visualization and Signals:
Plots the MA with regime colors, adds ATR-based bands, and fills areas for trend strength.
Triggers alerts on regime changes or band crosses, with the info panel suggesting strategies like momentum riding in trends.
💡 Note:
For optimal results, backtest settings on your preferred assets and combine with volume or momentum indicators. Remember, no indicator guarantees profits—use with proper risk management. Access premium features and support at PhenLabs.
Cari skrip untuk "Buy sell"

Kimchi Premium Dashboard (Final)📜 Kimchi Premium Dashboard (Live & Daily Log)
🚀 Summary
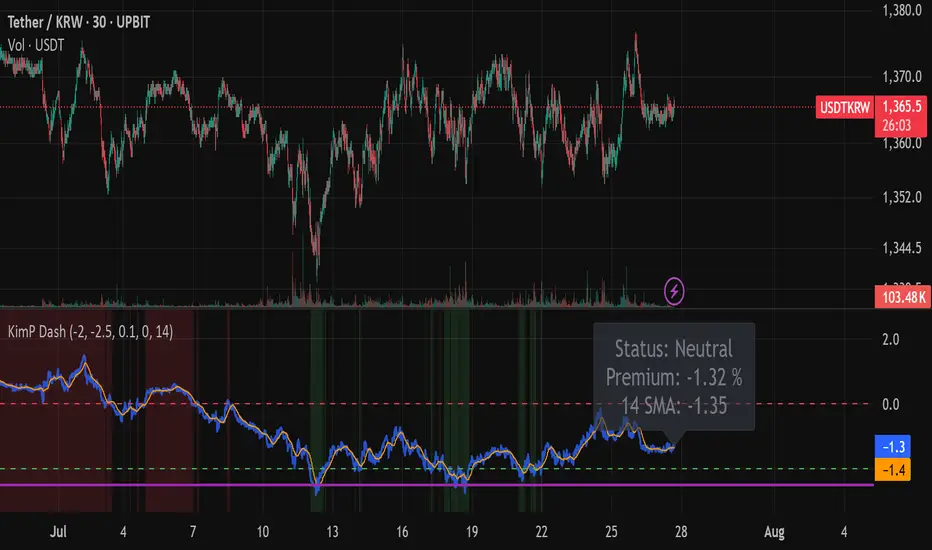
This indicator is an all-in-one dashboard that tracks the real-time price difference of USDT (Tether) between a Korean exchange (Upbit) and a global exchange (Coinbase). This difference is commonly known as the "Kimchi Premium" (Kimp) or "Reverse Premium."
Going beyond a simple premium display, this tool is designed to assist with arbitrage and swing trading strategies by providing intuitive visualizations, a smart multi-tier alert system, and a daily data logging feature.
✨ Key Features
Real-time Premium Calculation: Accurately calculates the premium in percentage (%) based on the USDT prices from Upbit and Coinbase, and the live USD/KRW exchange rate.
Intuitive Zone Visualization: Instantly identify whether the premium is in a Buy, Sell, or Neutral zone through dynamic background coloring.
Smart Alert System: Delivers systematic alerts for key events like the initial -2.0% entry, a critical -2.5% breach, and subsequent new lows, all without unnecessary spam. (Can be toggled ON/OFF in settings).
Hybrid Dashboard: Features both a real-time status label and a daily log that records the day's significant low points.
📊 Visual Components Explained
Lines
🔵 Blue Line (Premium Line): This is the core real-time premium value (%). The position of this line is most important.
🟠 Orange Line (SMA Line): This is the moving average of the premium. It helps identify the overall trend beyond short-term volatility.
Zones
🟩 Green Zone (Buy Zone): This area, typically below -2.0%, indicates a "Reverse Premium" where the Korean price is significantly lower than the global price. It represents a potential buying opportunity for arbitrage.
🟥 Red Zone (Kimp Zone): This area, typically above 0%, indicates a "Kimchi Premium" where the Korean price is higher. This represents a potential selling or profit-taking opportunity.
Dashboard
Live Status Label: Located on the right, this label displays the precise premium value, the current zone status (Buy/Sell/Neutral), and the SMA value in real-time.
Today's Lows Log: Located on the left, this table records the time and level of significant lows (below -2.5%) broken during the day. It resets automatically at midnight (UTC).
🔔 Alerts & How to Use
This indicator provides a systematic 3-tier alert system designed for arbitrage strategies. (Must be enabled via "Enable Real-time Alerts?" in settings).
✅ Good Opportunity (-2.0%): A one-time alert triggers upon the first entry into the initial buying zone.
🚨 BIG Opportunity (-2.5%): A distinct, high-priority alert triggers when this more critical level is breached.
📞 Granular Tracking (Below -2.5%): Receive alerts for each new low in -0.1% increments for precise tracking during the best opportunities.
A recommended hybrid strategy is to keep alerts off for daily review using the "Today's Lows Log," and turn them on only during critical periods for real-time action.
Disclaimer: The information provided by this indicator is for reference purposes only and does not constitute financial advice. All investment decisions and risks are the sole responsibility of the user.
VOLUME Simple [Titans_Invest]VOLUME Simple
A streamlined volume analysis tool crafted for simplicity and smart signal detection.
Although simple in appearance, this indicator brings intelligent volume-based entries through configurable logic. Its design emphasizes clean and effective interpretation of volume signals.
⯁ WHAT IS THE VOLUME INDICATOR❓
The Volume indicator is a fundamental technical analysis tool that measures the number of shares or contracts traded in a security or market during a given period. It helps traders and investors understand the strength or weakness of a price movement, confirm trends, and predict potential reversals. Volume is typically displayed as a histogram below a price chart, with each bar representing the volume traded during a specific time interval.
⯁ HOW TO USE THE VOLUME❓
The Volume indicator can be used in several ways to enhance trading decisions:
• Trend Confirmation: High volume during a price move confirms the strength of that trend, while low volume can indicate a weak or unsustainable trend.
• Breakouts: A price breakout from a pattern or range accompanied by high volume is more likely to be valid and sustainable.
• Divergence: When the price moves in one direction and volume moves in the opposite direction, it can signal a potential reversal.
• Overbought/Oversold Conditions: Extreme volume levels can sometimes indicate that an asset is overbought or oversold, though this is less straightforward than with oscillators like the RSI.
⯁ ENTRY CONDITIONS
The conditions below are fully flexible and allow for complete customization of the signal.
______________________________________________________
🔹 CONDITIONS TO BUY 📈
______________________________________________________
▪︎ Signal Validity: The signal will remain valid for X bars .
🔹 volume > volume_MA * Trigger Signal (close > open)
🔹 volume > volume_MA * Trigger Signal (Keep State)
______________________________________________________
______________________________________________________
🔸 CONDITIONS TO SELL 📉
______________________________________________________
▪︎ Signal Validity: The signal will remain valid for X bars .
🔸 volume > volume_MA * Trigger Signal (close > open)
🔸 volume > volume_MA * Trigger Signal (Keep State)
______________________________________________________
______________________________________________________
🤖 AUTOMATION 🤖
• You can automate the BUY and SELL signals of this indicator.
______________________________________________________
______________________________________________________
⯁ UNIQUE FEATURES
______________________________________________________
Signal Validity: The signal will remain valid for X bars
Condition Table: BUY/SELL
Condition Labels: BUY/SELL
Plot Labels in the Graph Above: BUY/SELL
Automate and Monitor Signals/Alerts: BUY/SELL
Signal Validity: The signal will remain valid for X bars
Table of Conditions: BUY/SELL
Conditions Label: BUY/SELL
Plot Labels in the graph above: BUY/SELL
Automate & Monitor Signals/Alerts: BUY/SELL
______________________________________________________
📜 SCRIPT : VOLUME Simple
🎴 Art by : @Titans_Invest & @DiFlip
👨💻 Dev by : @Titans_Invest & @DiFlip
🎑 Titans Invest — The Wizards Without Gloves 🧤
✨ Enjoy!
______________________________________________________
o Mission 🗺
• Inspire Traders to manifest Magic in the Market.
o Vision 𐓏
• To elevate collective Energy 𐓷𐓏

VSA-Stopping VolumeVSA Stopping Volume Indicator
Stopping Volume occurs when candles show decreasing body sizes (narrow spreads) while volume steadily increases.
Example chart:
As you see:
3 consecutive candles in same direction (all green OR all red)
Body sizes (spreads) decreasing progressively: Candle 1 > Candle 2 > Candle 3
Volume increasing progressively: Volume 1 < Volume 2 < Volume 3
This pattern indicates price absorption - increased buying/selling pressure but declining price movement, often signaling exhaustion and potential reversal.
Indicator Features
This indicator detects Stopping Volume candlestick clusters with two signal types:
🔹 BUY/SELL Signals: Generated when pattern occurs at support/resistance zones
🔹 Directional Alerts (▲-green, ▼-red): Generated when pattern occurs outside key levels
Trading Guidelines:
⚠️ Auto-drawn S/R zones are reference only - manual level plotting recommended for accuracy
📊 Best for scalping: M5, M10, M15 timeframes
🛡️ Stop Loss: Place beyond the S/R zone you're trading
🎯 Take Profit: Based on your risk management
Key Concept: Volume expansion + price contraction = potential reversal, especially at SnR levels.
Perfect for scalpers looking to catch reversals at critical zones!

Contrarian Market Structure BreakMarket Structure Break application was inspired and adapted from Market Structure Oscillator indicator developed by Lux Algo. So much credit to their work.
This indicator pairs nicely with the Contrarian 100 MA and can be located here:
Indicator Description: Contrarian Market Structure BreakOverview
The "Contrarian Market Structure Break" indicator is a versatile tool tailored for traders seeking to identify potential reversal opportunities by analyzing market structure across multiple timeframes. Built on Institutional Concepts of Structure (ICT), this indicator detects Break of Structure (BOS) and Change of Character (CHoCH) patterns across short-term, intermediate-term, and long-term swings, plotting them with customizable lines and labels. It generates contrarian buy and sell signals when price breaks key swing levels, with a unique "Blue Dot Tracker" to monitor consecutive buy signals for trend confirmation. Optimized for the daily timeframe, this indicator is adaptable to other timeframes with proper testing, making it ideal for traders of forex, stocks, or cryptocurrencies.
How It Works
The indicator combines three key components to provide a comprehensive view of market dynamics: Multi-Timeframe Market Structure Analysis: It identifies swing highs and lows across short-term, intermediate-term, and long-term periods, plotting BOS (continuation) and CHoCH (reversal) events with customizable line styles and labels.
Contrarian Signal Generation: Buy and sell signals are triggered when the price crosses below swing lows (buy) or above swing highs (sell), indicating potential reversals in overextended markets.
Blue Dot Tracker: A unique feature that counts consecutive buy signals ("blue dots") and highlights a "Hold Investment" state with a yellow background when three or more buy signals occur, suggesting a potential trend continuation.
Signals are visualized as small circles below (buy) or above (sell) price bars, and a table in the bottom-right corner displays the blue dot count and recommended action (Hold or Flip Investment), enhancing decision-making clarity.
Mathematical Concepts Swing Detection: The indicator identifies swing highs and lows by comparing price patterns over three bars, ensuring robust detection of pivot points. A swing high occurs when the middle bar’s high is higher than the surrounding bars, and a swing low occurs when the middle bar’s low is lower.
Market Structure Logic: BOS is detected when the price breaks a prior swing high (bullish) or low (bearish) in the direction of the current trend, while CHoCH signals a potential reversal when the price breaks a swing level against the trend. These are calculated across three timeframes for a multi-dimensional perspective.
Blue Dot Tracker: This feature counts consecutive buy signals and tracks the entry price. If three or more buy signals occur without a sell signal, the indicator enters a "Hold Investment" state, marked by a yellow background, until the price exceeds the entry price or a sell signal occurs.
Entry and Exit Rules Buy Signal (Blue Dot Below Bar): Triggered when the closing price crosses below a swing low on either the intermediate-term or long-term timeframe, suggesting an oversold condition and potential reversal upward. Short-term signals can be enabled but are disabled by default to reduce noise.
Sell Signal (White Dot Above Bar): Triggered when the closing price crosses above a swing high on either the intermediate-term or long-term timeframe, indicating an overbought condition and potential reversal downward.
Blue Dot Tracker Logic: After a buy signal, the indicator increments a blue dot counter and records the entry price. If three or more consecutive buy signals occur (blueDotCount ≥ 3), the indicator enters a "Hold Investment" state, highlighted with a yellow background, suggesting a potential trend continuation. The "Hold Investment" state ends when the price exceeds the entry price or a sell signal occurs, resetting the counter.
Exit Rules: Traders can exit buy positions when a sell signal appears, the price exceeds the entry price during a "Hold Investment" state, or based on additional confirmation from BOS/CHoCH patterns or other technical analysis tools. Always use proper risk management.
Recommended Usage
The indicator is optimized for the daily timeframe, where it effectively captures significant reversal and continuation patterns in trending or ranging markets. It can be adapted to other timeframes (e.g., 1H, 4H, 15M) with careful testing of settings, particularly enabling/disabling short-term structure analysis to suit market conditions. Backtesting is recommended to optimize performance for your chosen asset and timeframe.
Customization Options Market Structure Display: Toggle short-term, intermediate-term, and long-term structures on or off, with customizable line styles (solid, dashed, dotted) and colors for bullish and bearish breaks.
Labels: Enable or disable BOS/CHoCH labels for each timeframe to reduce chart clutter.
Signal Visibility: Hide buy/sell signals if desired for a cleaner chart.
Blue Dot Tracker: Monitor the blue dot count and action (Hold or Flip Investment) via the table display, which is fully customizable in terms of position and appearance.
Why Use This Indicator?
The "Contrarian Market Structure Break" indicator offers a robust framework for identifying high-probability reversal and continuation setups using ICT principles. Its multi-timeframe analysis, clear signal visualization, and innovative Blue Dot Tracker provide traders with actionable insights into market dynamics. Whether you're a swing trader or a day trader, this indicator’s flexibility and intuitive design make it a valuable addition to your trading arsenal.
Note for TradingView Moderators
This script complies with TradingView's House Rules by providing an educational and transparent description without performance claims or guarantees. It is designed to assist traders in technical analysis and should be used alongside proper risk management and personal research. The code is original, well-documented, and includes customizable inputs and clear visual outputs to enhance the user experience.
Tips for Users:
Backtest thoroughly on your chosen asset and timeframe to validate signal reliability. Combine with other indicators or price action analysis for confirmation of entries and exits. Adjust timeframe settings and enable/disable short-term structures to match market volatility and your trading style.
Hope the "Contrarian Market Structure Break" indicator enhances your trading strategy and helps you navigate the markets with confidence! Happy trading!

Easy Position Size Calculator with Fees# Easy Position Size Calculator with Fees - Manual
## Overview
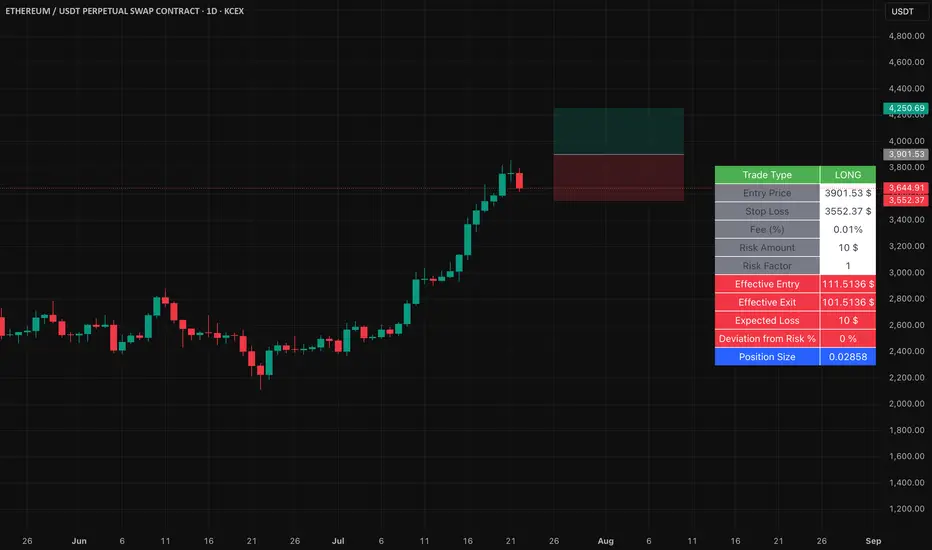
The Easy Position Size Calculator is a Pine Script indicator designed to help traders calculate the optimal position size for their trades while accounting for trading fees. This tool automatically determines whether you're planning a long or short position and calculates the exact position size needed to risk a specific dollar amount.
## Key Features
- **Automatic Trade Direction Detection**: Determines if you're going long or short based on entry price vs stop loss
- **Fee Integration**: Accounts for trading fees in position size calculations
- **Risk Management**: Calculates position size based on your specified risk amount
- **Risk Factor Adjustment**: Allows you to scale your position size up or down
- **Visual Display**: Shows all calculations in a clear, organized table
## Input Parameters
### Entry Price ($)
- **Purpose**: The price at which you plan to enter the trade
- **Default**: 0.0
- **Range**: Any positive value
- **Step**: 0.01
### Stop Loss ($)
- **Purpose**: The price at which you will exit the trade if it goes against you
- **Default**: 0.0
- **Range**: Any positive value
- **Step**: 0.01
### Risk ($)
- **Purpose**: The maximum dollar amount you're willing to lose on this trade
- **Default**: 0.0
- **Range**: Any positive value
- **Step**: 0.01
### Risk Factor
- **Purpose**: A multiplier to scale your position size up or down
- **Default**: 1.0 (no scaling)
- **Range**: 0.0 to 10.0
- **Step**: 0.1
- **Examples**:
- 1.0 = Normal position size
- 2.0 = Double the position size
- 0.5 = Half the position size
### Fee (%)
- **Purpose**: The percentage fee charged per transaction (buy/sell)
- **Default**: 0.01% (0.01)
- **Range**: 0.0% to 1.0%
- **Step**: 0.001
## How It Works
### Trade Direction Detection
The script automatically determines your trade direction:
- **Long Trade**: Entry price > Stop loss price
- **Short Trade**: Entry price < Stop loss price
### Position Size Calculation
#### For Long Trades:
```
Position Size = -Risk Factor × Risk Amount / (Stop Loss × (1 - Fee) - Entry Price × (1 + Fee))
```
#### For Short Trades:
```
Position Size = -Risk Factor × Risk Amount / (Entry Price × (1 - Fee) - Stop Loss × (1 + Fee))
```
### Fee Adjustment
The script accounts for fees on both entry and exit:
- **Long trades**: You pay fees when buying (entry) and selling (exit)
- **Short trades**: You pay fees when shorting (entry) and covering (exit)
## Output Display
The indicator displays a table with the following information:
### Trade Information
- **Trade Type**: Shows whether it's a LONG, SHORT, or INVALID trade
- **Entry Price**: Your specified entry price
- **Stop Loss**: Your specified stop loss price
- **Fee (%)**: The fee percentage being used
### Risk Parameters
- **Risk Amount**: The dollar amount you're willing to risk
- **Risk Factor**: The multiplier being applied
### Calculated Values
- **Effective Entry**: The actual cost per share including fees
- **Effective Exit**: The actual exit value per share including fees
- **Expected Loss**: The calculated loss if stop loss is hit
- **Deviation from Risk %**: Shows how close the expected loss is to your target risk
- **Position Size**: The number of shares/units to trade
## Usage Examples
### Example 1: Long Trade
- Entry Price: $100.00
- Stop Loss: $95.00
- Risk Amount: $500.00
- Risk Factor: 1.0
- Fee: 0.01%
**Result**: The script will calculate how many shares to buy so that if the stop loss is hit, you lose approximately $500 (accounting for fees). Position Size: 99.61152
### Example 2: Short Trade
- Entry Price: $50.00
- Stop Loss: $55.00
- Risk Amount: $300.00
- Risk Factor: 1.0
- Fee: 0.01%
**Result**: The script will calculate how many shares to short so that if the stop loss is hit, you lose approximately $300 (accounting for fees). Position Size: 59.87426
## Important Notes
### Validation Requirements
For the script to work properly, all of the following must be true:
- Entry price > 0
- Stop loss > 0
- Risk amount > 0
- Entry price ≠ Stop loss (to determine direction)
### Negative Position Sizes
The script may show negative position sizes, which is normal:
- **Negative values for long trades**: Represents shares to buy
- **Negative values for short trades**: Represents shares to short
### Risk Deviation
The "Deviation from Risk %" shows how closely the calculated position size matches your target risk. Small deviations are normal due to:
- Fee calculations
- Rounding
- Market precision
## Color Coding
The table uses color coding for easy identification:
- **Green**: Long trade information
- **Red**: Short trade information
- **Gray**: Invalid trade (when inputs are incorrect)
- **Blue**: Final position size
- **Red background**: Risk-related calculations
## Troubleshooting
### Common Issues
1. **Position Size shows 0**
- Check that all inputs are greater than 0
- Ensure entry price is different from stop loss
2. **Trade Type shows INVALID**
- Verify that entry price and stop loss are both positive
- Make sure entry price ≠ stop loss
3. **Large Risk Deviation**
- This is normal for very small position sizes
- Consider adjusting your risk amount or price levels
## Best Practices
1. **Always validate your inputs** before placing actual trades
2. **Double-check the trade direction** shown in the table
3. **Review the expected loss** to ensure it aligns with your risk management
4. **Consider the effective entry/exit prices** which include fees
5. **Use appropriate risk factors** - avoid extreme values that could lead to overexposure
## Disclaimer
This tool is for educational and planning purposes only. Always verify calculations manually and consider market conditions, liquidity, and other factors before placing actual trades. The script assumes that fees are charged on both entry and exit transactions.
Support Resistance with Order BlocksIndicator Description
Professional Price Level Detection for Smart Trading. Master the Markets with Precision Support/Resistance and Order Block Analysis . It provides traders with clear visual cues for potential reversal and breakout areas, combining both retail and institutional trading concepts into one powerful tool.
The Support & Resistance with Order Blocks indicator is a versatile Pine Script tool designed to empower traders with clear, actionable insights into key market levels. By combining advanced pivot-based support and resistance (S/R) detection with order block (OB) filtering, this indicator delivers clean, high-probability zones for entries, exits, and reversals. With customizable display options (boxes or lines) and intuitive settings, it’s perfect for traders of all styles—whether you’re scalping, swing trading, or investing long-term. Overlay it on your TradingView chart and elevate your trading strategy today!
________________________________________
Key Features
✅ Dynamic Support/Resistance - Auto-adjusting levels based on price action
✅ Smart Order Block Detection - Identifies institutional buying/selling zones
✅ Dual Display Modes - Choose between Boxes or Clean Lines for different chart styles
✅ Customizable Sensitivity - Adjust detection parameters for different markets
✅ Broken Level Markers - Clearly shows when key levels are breached
✅ Timeframe-Adaptive - Automatically adjusts for daily/weekly charts
1. Dynamic Support & Resistance Detection
Identifies critical S/R zones using pivot high/low calculations with adjustable look back periods.
Visualizes active S/R zones with distinct colors and labels ("Support" or "Resistance" for boxes, lines for cleaner charts).
Marks broken S/R levels as "Br S" (broken support) or "Br R" (broken resistance) when historical display is enabled, aiding in breakout and reversal analysis.
2. Smart Order Block Identification
Detects bullish and bearish order blocks based on significant price movements (default: ±0.3% over 5 candles).
Highlights institutional buying/selling zones with customizable colors, displayed as boxes or lines.
Filters out overlapping OB zones to keep your chart clutter-free.
3. Dual Display Options
Boxes or Lines: Choose to display S/R and OB as boxes for detailed zones or lines for a minimalist view.
Line Width Customization: Adjust line widths for S/R and OB (1–5 pixels) for optimal visibility.
Color Customization: Tailor colors for active/broken S/R and bullish/bearish OB zones.
4. Advanced Overlap Filtering
Ensures S/R zones don’t overlap with OB zones or other S/R levels, providing only the most relevant levels.
Limits the number of active zones (default: 10) to maintain chart clarity.
5. Historical S/R Visualization
Optionally display broken S/R levels with distinct colors and labels ("Br S" or "Br R") to track historical price reactions.
Broken levels are dynamically updated and removed (or retained) based on user settings.
6. Timeframe Adaptability
Automatically adjusts pivot detection for daily/weekly timeframes (40-candle look back) versus shorter timeframes (20-candle look back).
Works seamlessly across all asset classes (stocks, forex, crypto, etc.) and timeframes.
________________________________________
How It Works
• Support & Resistance:
Uses ta.pivothigh and ta.pivotlow to detect significant price pivots, with a user-defined look back (default: 5 candles post-pivot).
Plots S/R as boxes (with labels "Support" or "Resistance") or lines, extending to the current bar for real-time relevance.
Broken S/R levels are marked with adjusted colors and labels ("S" or "R" for boxes, "Br S" or "Br R" for lines when historical display is enabled).
• Order Blocks:
Identifies OB based on strong price movements over 4 candles, plotted as boxes or lines at the candle’s midpoint.
Validates OB to prevent overlap, ensuring only significant zones are displayed.
Removes OB zones when price breaks through, keeping the chart focused on active levels.
• Customization:
Toggle S/R and OB visibility, adjust detection sensitivity, and set maximum active zones (4–50).
Fine-tune line widths and colors for a personalized chart experience.
________________________________________
Why Use This Indicator?
• Precision Trading: Pinpoint high-probability entry/exit zones with filtered S/R and OB levels.
• Clean Charts: Overlap filtering and zone limits reduce clutter, focusing on key levels.
• Versatile Display: Switch between boxes for detailed zones or lines for simplicity, with adjustable line widths.
• Institutional Edge: Leverage OB detection to align with institutional activity for smarter trades.
• User-Friendly: Intuitive settings and clear visuals make it accessible for beginners and pros alike.
________________________________________
Settings Overview________________________________________
⚙ Input Parameters
Settings Overview
Display Options:
Display Type: Choose "Boxes" or "Lines" for S/R and OB visualization.
S/R Line Width: Set line thickness for S/R lines (1–5 pixels, default: 2).
OB Line Width: Set line thickness for OB lines (1–5 pixels, default: 2).
Order Block Options:
Show Order Block: Enable/disable OB display.
Bull/Bear OB Colors: Customise border and fill colors for bullish and bearish OB zones.
Support/Resistance Options:
Show S/R: Toggle active S/R zones.
Show Historical S/R: Display broken S/R levels, marked as "Br S" or "Br R" for lines.
Detection Period: Set candle lookback for pivot detection (4–50, default: 5).
Max Active Zones: Limit active S/R and OB zones (4–50, default: 10).
Colors: Customise active and broken S/R colors for clear differentiation.
________________________________________
How to Use
1. Add to Chart: Apply the indicator to your TradingView chart.
2. Customize Settings:
o Select "Boxes" or "Lines" for your preferred display style.
o Adjust line widths, colors, and detection parameters to suit your trading style.
o Enable "Show Historical S/R" to track broken levels with "Br S" and "Br R" labels.
3. Analyze Levels:
o Use support zones (green) for buy entries and resistance zones (red) for sell entries.
o Monitor OB zones for institutional activity, signaling potential reversals or continuations.
o Watch for "Br S" or "Br R" labels to identify breakout opportunities.
4. Combine with Other Tools: Pair with trend indicators, volume analysis, or price action for a robust strategy.
5. Monitor Breakouts: Trade breakouts when price breaches S/R or OB zones, with historical labels providing context.
________________________________________
Example Use Cases
• Swing Trading: Use S/R and OB zones to identify entry/exit points, with historical broken levels for context.
• Breakout Trading: Trade price breaks through S/R or OB, using "Br S" and "Br R" labels to confirm reversals.
• Scalping: Adjust detection period for faster S/R and OB identification on lower timeframes.
________________________________________
• Performance: Optimized for all timeframes, with best results on 5M, 15M, 30M, 1H, 4H, or daily charts for swing trading.
• Compatibility: Works with any asset class and TradingView chart.
________________________________________
Get Started
Transform your trading with Support & Resistance with Order Blocks! Add it to your chart, customize it to your style, and trade with confidence. For questions or feedback, drop a comment on TradingView or message the author. Happy trading! 🚀
________________________________________
Disclaimer: This indicator is for educational and informational purposes only. Always conduct your own analysis and practice proper risk management before trading.

Advanced Currency Strength Meter# Advanced Currency Strength Meter (ACSM)
The Advanced Currency Strength Meter (ACSM) is a scientifically-based indicator that measures relative currency strength using established academic methodologies from international finance and behavioral economics. This indicator provides traders with a comprehensive view of currency market dynamics through multiple analytical frameworks.
### Theoretical Foundation
#### 1. Purchasing Power Parity (PPP) Theory
Based on Cassel's (1918) seminal work and refined by Froot & Rogoff (1995), PPP suggests that exchange rates should reflect relative price levels between countries. The ACSM momentum component captures deviations from long-term equilibrium relationships, providing insights into currency misalignments.
#### 2. Uncovered Interest Rate Parity (UIP) and Carry Trade Theory
Building on Fama (1984) and Lustig et al. (2007), the indicator incorporates volatility-adjusted momentum to capture carry trade flows and interest rate differentials that drive currency strength. This approach helps identify currencies benefiting from interest rate differentials.
#### 3. Behavioral Finance and Currency Momentum
Following Burnside et al. (2011) and Menkhoff et al. (2012), the model recognizes that currency markets exhibit persistent momentum effects due to behavioral biases and institutional flows. The indicator captures these momentum patterns for trading opportunities.
#### 4. Portfolio Balance Theory
Based on Branson & Henderson (1985), the relative strength matrix captures how portfolio rebalancing affects currency cross-rates and creates trading opportunities between different currency pairs.
### Technical Implementation
#### Core Methodologies:
- **Z-Score Normalization**: Following Sharpe (1994), provides statistical significance testing without arbitrary scaling
- **Momentum Analysis**: Uses return-based metrics (Jegadeesh & Titman, 1993) for trend identification
- **Volatility Adjustment**: Implements Average True Range methodology (Wilder, 1978) for risk-adjusted strength
- **Composite Scoring**: Equal-weight methodology to avoid overfitting and maintain robustness
- **Correlation Analysis**: Risk management framework based on Markowitz (1952) portfolio theory
#### Key Features:
- **Multi-Source Data Integration**: Supports OANDA, Futures, and CFD data sources
- **Scientific Methodology**: No arbitrary scaling or curve-fitting; all calculations based on established statistical methods
- **Comprehensive Dashboard**: Clean, professional table showing currency strengths and best trading pairs
- **Alert System**: Automated notifications for strong/weak currency conditions and extreme values
- **Best Pair Identification**: Algorithmic detection of highest-potential trading opportunities
### Practical Applications
#### For Swing Traders:
- Identify currencies in strong uptrends or downtrends
- Select optimal currency pairs based on relative strength divergence
- Time entries based on momentum convergence/divergence
#### For Day Traders:
- Use with real-time futures data for intraday opportunities
- Monitor currency correlations for risk management
- Detect early reversal signals through extreme value alerts
#### For Portfolio Managers:
- Multi-currency exposure analysis
- Risk management through correlation monitoring
- Strategic currency allocation decisions
### Visual Design
The indicator features a clean, professional dashboard that displays:
- **Currency Strength Values**: Each major currency (EUR, GBP, JPY, CHF, AUD, CAD, NZD, USD) with color-coded strength values
- **Best Trading Pairs**: Filtered list of highest-potential currency pairs with BUY/SELL signals
- **Market Analysis**: Real-time identification of strongest and weakest currencies
- **Potential Score**: Quantitative measure of trading opportunity strength
### Data Sources and Latency
The indicator supports multiple data sources to accommodate different trading needs:
- **OANDA (Delayed)**: Free data with 15-20 minute delay, suitable for swing trading
- **Futures (Real-time)**: CME currency futures for real-time analysis
- **CFDs**: Alternative real-time data source option
### Mathematical Framework
#### Strength Calculation:
Momentum = (Price - Price ) / Price * 100
Z-Score = (Price - Mean) / Standard Deviation
Volatility-Adjusted = Momentum / ATR-based Volatility
Composite = 0.5 * Momentum + 0.3 * Z-Score + 0.2 * Volatility-Adjusted
#### USD Strength Derivation:
USD strength is calculated as the weighted average of all USD-based pairs, providing a true baseline for relative strength comparison.
### Performance Considerations
The indicator is optimized for:
- **Computational Efficiency**: Uses Pine Script v6 best practices
- **Memory Management**: Appropriate lookback periods and array handling
- **Visual Clarity**: Clean table design optimized for both light and dark themes
- **Alert Reliability**: Robust signal generation with statistical significance testing
### Limitations and Risk Disclosure
- Model performance may vary during extreme market stress (Black Swan events)
- Requires stable data feeds for accurate calculations
- Not optimized for high-frequency scalping strategies
- Central bank interventions may temporarily distort signals
- Performance assumes normal market conditions with behavioral adjustments
### Academic References
- Branson, W. H., & Henderson, D. W. (1985). "The Specification and Influence of Asset Markets"
- Burnside, C., Eichenbaum, M., & Rebelo, S. (2011). "Carry Trade and Momentum in Currency Markets"
- Cassel, G. (1918). "Abnormal Deviations in International Exchanges"
- Fama, E. F. (1984). "Forward and Spot Exchange Rates"
- Froot, K. A., & Rogoff, K. (1995). "Perspectives on PPP and Long-Run Real Exchange Rates"
- Jegadeesh, N., & Titman, S. (1993). "Returns to Buying Winners and Selling Losers"
- Lustig, H., Roussanov, N., & Verdelhan, A. (2007). "Common Risk Factors in Currency Markets"
- Markowitz, H. (1952). "Portfolio Selection"
- Menkhoff, L., Sarno, L., Schmeling, M., & Schrimpf, A. (2012). "Carry Trades and Global FX Volatility"
- Sharpe, W. F. (1994). "The Sharpe Ratio"
- Wilder, J. W. (1978). "New Concepts in Technical Trading Systems"
### Usage Instructions
1. **Setup**: Add the indicator to your chart and select your preferred data source
2. **Currency Selection**: Choose which currencies to analyze (default: all major currencies)
3. **Methodology**: Select calculation method (Composite recommended for most users)
4. **Monitoring**: Watch the dashboard for strength changes and best pair opportunities
5. **Alerts**: Set up notifications for strong/weak currency conditions

Chaikin Money Flow (CMF) [ParadoxAlgo]OVERVIEW
This indicator implements the Chaikin Money Flow oscillator as an overlay on the price chart, designed to help traders identify institutional money flow patterns. The Chaikin Money Flow combines price and volume data to measure the flow of money into and out of a security, making it particularly useful for detecting accumulation and distribution phases.
WHAT IS CHAIKIN MONEY FLOW?
Chaikin Money Flow was developed by Marc Chaikin and measures the amount of Money Flow Volume over a specific period. The indicator oscillates between +1 and -1, where:
Positive values indicate money flowing into the security (accumulation)
Negative values indicate money flowing out of the security (distribution)
Values near zero suggest equilibrium between buying and selling pressure
CALCULATION METHOD
Money Flow Multiplier = ((Close - Low) - (High - Close)) / (High - Low)
Money Flow Volume = Money Flow Multiplier × Volume
CMF = Sum of Money Flow Volume over N periods / Sum of Volume over N periods
KEY FEATURES
Big Money Detection:
Identifies significant institutional activity when CMF exceeds user-defined thresholds
Requires volume confirmation (volume above average) to validate signals
Uses battery icon (🔋) for institutional buying and lightning icon (⚡) for institutional selling
Visual Elements:
Background coloring based on money flow direction
Support and resistance levels calculated using Average True Range
Real-time dashboard showing current CMF value, volume strength, and signal status
Customizable Parameters:
CMF Period: Calculation period for the money flow (default: 20)
Signal Smoothing: EMA smoothing applied to reduce noise (default: 5)
Big Money Threshold: CMF level required to trigger institutional signals (default: 0.15)
Volume Threshold: Volume multiplier required for signal confirmation (default: 1.5x)
INTERPRETATION
Signal Types:
🔋 (Battery): Indicates strong institutional buying when CMF > threshold with high volume
⚡ (Lightning): Indicates strong institutional selling when CMF < -threshold with high volume
Background color: Green tint for positive money flow, red tint for negative money flow
Dashboard Information:
CMF Value: Current Chaikin Money Flow reading
Volume: Current volume as a multiple of 20-period average
Big Money: Status of institutional activity (BUYING/SELLING/QUIET)
Signal: Strength assessment (STRONG/MEDIUM/WEAK)
TRADING APPLICATIONS
Trend Confirmation: Use CMF direction to confirm price trends
Divergence Analysis: Look for divergences between price and money flow
Volume Validation: Confirm breakouts with corresponding money flow
Accumulation/Distribution: Identify phases of institutional activity
PARAMETER RECOMMENDATIONS
Day Trading: CMF Period 14-21, higher sensitivity settings
Swing Trading: CMF Period 20-30, moderate sensitivity
Position Trading: CMF Period 30-50, lower sensitivity for major trends
ALERTS
Optional alert system notifies users when:
Big money buying is detected (CMF above threshold with volume confirmation)
Big money selling is detected (CMF below negative threshold with volume confirmation)
LIMITATIONS
May generate false signals in low-volume conditions
Best used in conjunction with other technical analysis tools
Effectiveness varies across different market conditions and timeframes
EDUCATIONAL PURPOSE
This open-source indicator is provided for educational purposes to help traders understand money flow analysis. It demonstrates the practical application of the Chaikin Money Flow concept with visual enhancements for easier interpretation.
TECHNICAL SPECIFICATIONS
Overlay indicator (displays on price chart)
No repainting - all calculations are based on closed bar data
Suitable for all timeframes and asset classes
Minimal resource usage for optimal performance
DISCLAIMER
This indicator is for educational and informational purposes only. Past performance does not guarantee future results. Always conduct your own analysis and consider risk management before making trading decisions.

Contrarian RSIContrarian RSI Indicator
Pairs nicely with Contrarian 100 MA (optional hide/unhide buy/sell signals)
Description
The Contrarian RSI is a momentum-based technical indicator designed to identify potential reversal points in price action by combining a unique RSI calculation with a predictive range model inspired by the "Contrarian 5 Levels" logic. Unlike traditional RSI, which measures price momentum based solely on price changes, this indicator integrates a smoothed, weighted momentum calculation and predictive price ranges to generate contrarian signals. It is particularly suited for traders looking to capture reversals in trending or range-bound markets.
This indicator is versatile and can be used across various timeframes, though it performs best on higher timeframes (e.g., 1H, 4H, or Daily) due to reduced noise and more reliable signals. Lower timeframes may require additional testing and careful parameter tuning to optimize performance.
How It Works
The Contrarian RSI combines two primary components:
Predictive Ranges (5 Levels Logic): This calculates a smoothed price average that adapts to market volatility using an ATR-based mechanism. It helps identify significant price levels that act as potential support or resistance zones.
Contrarian RSI Calculation: A modified RSI calculation that uses weighted momentum from the predictive ranges to measure buying and selling pressure. The result is smoothed and paired with a user-defined moving average to generate clear signals.
The indicator generates buy (long) and sell (exit) signals based on crossovers and crossunders of user-defined overbought and oversold levels, making it ideal for contrarian trading strategies.
Calculation Overview
Predictive Ranges (5 Levels Logic):
Uses a custom function (pred_ranges) to calculate a dynamic price average (avg) based on the ATR (Average True Range) multiplied by a user-defined factor (mult).
The average adjusts only when the price moves beyond the ATR threshold, ensuring responsiveness to significant price changes while filtering out noise.
This calculation is performed on a user-specified timeframe (tf5Levels) for multi-timeframe analysis.
Contrarian RSI:
Compares consecutive predictive range values to calculate gains (g) and losses (l) over a user-defined period (crsiLength).
Applies a Gaussian weighting function (weight = math.exp(-math.pow(i / crsiLength, 2))) to prioritize recent price movements.
Computes a "wave ratio" (net_momentum / total_energy) to normalize momentum, which is then scaled to a 0–100 range (qrsi = 50 + 50 * wave_ratio).
Smooths the result with a 2-period EMA (qrsi_smoothed) for stability.
Moving Average:
Applies a user-selected moving average (SMA, EMA, WMA, SMMA, or VWMA) with a customizable length (maLength) to the smoothed RSI (qrsi_smoothed) to generate the final indicator value (qrsi_ma).
Signal Generation:
Long Entry: Triggered when qrsi_ma crosses above the oversold level (oversoldLevel, default: 1).
Long Exit: Triggered when qrsi_ma crosses below the overbought level (overboughtLevel, default: 99).
Entry and Exit Rules
Long Entry: Enter a long position when the Contrarian RSI (qrsi_ma) crosses above the oversold level (default: 1). This suggests the asset is potentially oversold and due for a reversal.
Long Exit: Exit the long position when the Contrarian RSI (qrsi_ma) crosses below the overbought level (default: 99), indicating a potential overbought condition and a reversal to the downside.
Customization: Adjust overboughtLevel and oversoldLevel to fine-tune sensitivity. Lower timeframes may benefit from tighter levels (e.g., 20 for oversold, 80 for overbought), while higher timeframes can use extreme levels (e.g., 1 and 99) for stronger reversals.
Timeframe Considerations
Higher Timeframes (Recommended): The indicator is optimized for higher timeframes (e.g., 1H, 4H, Daily) due to its reliance on predictive ranges and smoothed momentum, which perform best with less market noise. These timeframes typically yield more reliable reversal signals.
Lower Timeframes: The indicator can be used on lower timeframes (e.g., 5M, 15M), but signals may be noisier and require additional confirmation (e.g., from price action or other indicators). Extensive backtesting and parameter optimization (e.g., adjusting crsiLength, maLength, or mult) are recommended for lower timeframes.
Inputs
Contrarian RSI Length (crsiLength): Length for RSI momentum calculation (default: 5).
RSI MA Length (maLength): Length of the moving average applied to the RSI (default: 1, effectively no MA).
MA Type (maType): Choose from SMA, EMA, WMA, SMMA, or VWMA (default: SMA).
Overbought Level (overboughtLevel): Upper threshold for exit signals (default: 99).
Oversold Level (oversoldLevel): Lower threshold for entry signals (default: 1).
Plot Signals on Main Chart (plotOnChart): Toggle to display signals on the price chart or the indicator panel (default: false).
Plotted on Lower:
Plotted on Chart:
5 Levels Length (length5Levels): Length for predictive range calculation (default: 200).
Factor (mult): ATR multiplier for predictive ranges (default: 6.0).
5 Levels Timeframe (tf5Levels): Timeframe for predictive range calculation (default: chart timeframe).
Visuals
Contrarian RSI MA: Plotted as a yellow line, representing the smoothed Contrarian RSI with the applied moving average.
Overbought/Oversold Lines: Red line for overbought (default: 99) and green line for oversold (default: 1).
Signals: Blue circles for long entries, white circles for long exits. Signals can be plotted on the main chart (plotOnChart = true) or the indicator panel (plotOnChart = false).
Usage Notes
Use the indicator in conjunction with other tools (e.g., support/resistance, trendlines, or volume) to confirm signals.
Test extensively on your chosen timeframe and asset to optimize parameters like crsiLength, maLength, and mult.
Be cautious with lower timeframes, as false signals may occur due to market noise.
The indicator is designed for contrarian strategies, so it works best in markets with clear reversal patterns.
Disclaimer
This indicator is provided for educational and informational purposes only. Always conduct thorough backtesting and risk management before using any indicator in live trading. The author is not responsible for any financial losses incurred.

Momentum Trajectory Suite📈 Momentum Trajectory Suite
🟢 Overview
Momentum Trajectory Suite is a multi-faceted indicator designed to help traders evaluate trend direction, volatility conditions, and behavioral sentiment in a single consolidated view.
By combining a customizable Trajectory EMA, adaptive Bollinger Bands, and a Greed vs. Fear heatmap, this tool empowers traders to identify directional bias, measure momentum strength, and spot potential reversals or continuation setups.
🧠 Concept
This indicator merges three classic techniques:
Trend Analysis: Trajectory EMA highlights the prevailing directional momentum by smoothing price action over a customizable period.
Volatility Envelopes: Bollinger Bands adapt to dynamic price swings, showing overbought/oversold extremes and periods of contraction or expansion.
Behavioral Sentiment: A Greed vs. Fear heatmap combines RSI and MACD Histogram readings to visualize when markets are dominated by buying enthusiasm or selling pressure.
The combination is designed to help traders interpret market context more effectively than using any single component alone.
🛠️ How to Use the Indicator
Trajectory EMA:
Use the blue EMA line to assess overall trend direction.
Price closing above the EMA may indicate bullish momentum; closing below may indicate bearish bias.
Buy/Sell Signals:
Green circles appear when price crosses above the EMA (potential long entry).
Red circles appear when price crosses below the EMA (potential exit or short entry).
Bollinger Bands:
Monitor upper/lower bands for overbought and oversold price extremes.
Narrowing bands may signal upcoming volatility expansion.
Greed vs. Fear Heatmap:
Green histogram bars indicate bullish sentiment when RSI exceeds 60 and MACD Histogram is positive.
Red histogram bars indicate bearish sentiment when RSI is below 40 and MACD Histogram is negative.
Gray bars indicate neutral or mixed conditions.
Background Color Zones:
The chart background shifts to green when EMA slope is positive and red when negative, providing quick directional cues.
All inputs are adjustable in settings, including EMA length, Bollinger Band parameters, and oscillator configurations.
📊 Interpretation
Bullish Conditions:
Price above the Trajectory EMA, background green, and Greed heatmap active.
May signal trend continuation and increased buying pressure.
Bearish Conditions:
Price below the Trajectory EMA, background red, and Fear heatmap active.
May signal momentum breakdown or potential continuation to the downside.
Volatility Clues:
Wide Bollinger Bands = trending, volatile market.
Narrow Bollinger Bands = low volatility and possible breakout setup.
Signal Confirmation:
Consider combining signals (e.g., EMA crossover + Greed/Fear heatmap + Bollinger Band touch) for higher-confidence entries.
📝 Notes
The script does not repaint or use future data.
Suitable for multiple timeframes (intraday to daily).
May be combined with other confirmation tools or price action analysis.
⚠️ Disclaimer
This script is for educational and informational purposes only and does not constitute financial advice. Trading carries risk and past performance is not indicative of future results. Always perform your own due diligence before making trading decisions.

Tensor Market Analysis Engine (TMAE)# Tensor Market Analysis Engine (TMAE)
## Advanced Multi-Dimensional Mathematical Analysis System
*Where Quantum Mathematics Meets Market Structure*
---
## 🎓 THEORETICAL FOUNDATION
The Tensor Market Analysis Engine represents a revolutionary synthesis of three cutting-edge mathematical frameworks that have never before been combined for comprehensive market analysis. This indicator transcends traditional technical analysis by implementing advanced mathematical concepts from quantum mechanics, information theory, and fractal geometry.
### 🌊 Multi-Dimensional Volatility with Jump Detection
**Hawkes Process Implementation:**
The TMAE employs a sophisticated Hawkes process approximation for detecting self-exciting market jumps. Unlike traditional volatility measures that treat price movements as independent events, the Hawkes process recognizes that market shocks cluster and exhibit memory effects.
**Mathematical Foundation:**
```
Intensity λ(t) = μ + Σ α(t - Tᵢ)
```
Where market jumps at times Tᵢ increase the probability of future jumps through the decay function α, controlled by the Hawkes Decay parameter (0.5-0.99).
**Mahalanobis Distance Calculation:**
The engine calculates volatility jumps using multi-dimensional Mahalanobis distance across up to 5 volatility dimensions:
- **Dimension 1:** Price volatility (standard deviation of returns)
- **Dimension 2:** Volume volatility (normalized volume fluctuations)
- **Dimension 3:** Range volatility (high-low spread variations)
- **Dimension 4:** Correlation volatility (price-volume relationship changes)
- **Dimension 5:** Microstructure volatility (intrabar positioning analysis)
This creates a volatility state vector that captures market behavior impossible to detect with traditional single-dimensional approaches.
### 📐 Hurst Exponent Regime Detection
**Fractal Market Hypothesis Integration:**
The TMAE implements advanced Rescaled Range (R/S) analysis to calculate the Hurst exponent in real-time, providing dynamic regime classification:
- **H > 0.6:** Trending (persistent) markets - momentum strategies optimal
- **H < 0.4:** Mean-reverting (anti-persistent) markets - contrarian strategies optimal
- **H ≈ 0.5:** Random walk markets - breakout strategies preferred
**Adaptive R/S Analysis:**
Unlike static implementations, the TMAE uses adaptive windowing that adjusts to market conditions:
```
H = log(R/S) / log(n)
```
Where R is the range of cumulative deviations and S is the standard deviation over period n.
**Dynamic Regime Classification:**
The system employs hysteresis to prevent regime flipping, requiring sustained Hurst values before regime changes are confirmed. This prevents false signals during transitional periods.
### 🔄 Transfer Entropy Analysis
**Information Flow Quantification:**
Transfer entropy measures the directional flow of information between price and volume, revealing lead-lag relationships that indicate future price movements:
```
TE(X→Y) = Σ p(yₜ₊₁, yₜ, xₜ) log
```
**Causality Detection:**
- **Volume → Price:** Indicates accumulation/distribution phases
- **Price → Volume:** Suggests retail participation or momentum chasing
- **Balanced Flow:** Market equilibrium or transition periods
The system analyzes multiple lag periods (2-20 bars) to capture both immediate and structural information flows.
---
## 🔧 COMPREHENSIVE INPUT SYSTEM
### Core Parameters Group
**Primary Analysis Window (10-100, Default: 50)**
The fundamental lookback period affecting all calculations. Optimization by timeframe:
- **1-5 minute charts:** 20-30 (rapid adaptation to micro-movements)
- **15 minute-1 hour:** 30-50 (balanced responsiveness and stability)
- **4 hour-daily:** 50-100 (smooth signals, reduced noise)
- **Asset-specific:** Cryptocurrency 20-35, Stocks 35-50, Forex 40-60
**Signal Sensitivity (0.1-2.0, Default: 0.7)**
Master control affecting all threshold calculations:
- **Conservative (0.3-0.6):** High-quality signals only, fewer false positives
- **Balanced (0.7-1.0):** Optimal risk-reward ratio for most trading styles
- **Aggressive (1.1-2.0):** Maximum signal frequency, requires careful filtering
**Signal Generation Mode:**
- **Aggressive:** Any component signals (highest frequency)
- **Confluence:** 2+ components agree (balanced approach)
- **Conservative:** All 3 components align (highest quality)
### Volatility Jump Detection Group
**Volatility Dimensions (2-5, Default: 3)**
Determines the mathematical space complexity:
- **2D:** Price + Volume volatility (suitable for clean markets)
- **3D:** + Range volatility (optimal for most conditions)
- **4D:** + Correlation volatility (advanced multi-asset analysis)
- **5D:** + Microstructure volatility (maximum sensitivity)
**Jump Detection Threshold (1.5-4.0σ, Default: 3.0σ)**
Standard deviations required for volatility jump classification:
- **Cryptocurrency:** 2.0-2.5σ (naturally volatile)
- **Stock Indices:** 2.5-3.0σ (moderate volatility)
- **Forex Major Pairs:** 3.0-3.5σ (typically stable)
- **Commodities:** 2.0-3.0σ (varies by commodity)
**Jump Clustering Decay (0.5-0.99, Default: 0.85)**
Hawkes process memory parameter:
- **0.5-0.7:** Fast decay (jumps treated as independent)
- **0.8-0.9:** Moderate clustering (realistic market behavior)
- **0.95-0.99:** Strong clustering (crisis/event-driven markets)
### Hurst Exponent Analysis Group
**Calculation Method Options:**
- **Classic R/S:** Original Rescaled Range (fast, simple)
- **Adaptive R/S:** Dynamic windowing (recommended for trading)
- **DFA:** Detrended Fluctuation Analysis (best for noisy data)
**Trending Threshold (0.55-0.8, Default: 0.60)**
Hurst value defining persistent market behavior:
- **0.55-0.60:** Weak trend persistence
- **0.65-0.70:** Clear trending behavior
- **0.75-0.80:** Strong momentum regimes
**Mean Reversion Threshold (0.2-0.45, Default: 0.40)**
Hurst value defining anti-persistent behavior:
- **0.35-0.45:** Weak mean reversion
- **0.25-0.35:** Clear ranging behavior
- **0.15-0.25:** Strong reversion tendency
### Transfer Entropy Parameters Group
**Information Flow Analysis:**
- **Price-Volume:** Classic flow analysis for accumulation/distribution
- **Price-Volatility:** Risk flow analysis for sentiment shifts
- **Multi-Timeframe:** Cross-timeframe causality detection
**Maximum Lag (2-20, Default: 5)**
Causality detection window:
- **2-5 bars:** Immediate causality (scalping)
- **5-10 bars:** Short-term flow (day trading)
- **10-20 bars:** Structural flow (swing trading)
**Significance Threshold (0.05-0.3, Default: 0.15)**
Minimum entropy for signal generation:
- **0.05-0.10:** Detect subtle information flows
- **0.10-0.20:** Clear causality only
- **0.20-0.30:** Very strong flows only
---
## 🎨 ADVANCED VISUAL SYSTEM
### Tensor Volatility Field Visualization
**Five-Layer Resonance Bands:**
The tensor field creates dynamic support/resistance zones that expand and contract based on mathematical field strength:
- **Core Layer (Purple):** Primary tensor field with highest intensity
- **Layer 2 (Neutral):** Secondary mathematical resonance
- **Layer 3 (Info Blue):** Tertiary harmonic frequencies
- **Layer 4 (Warning Gold):** Outer field boundaries
- **Layer 5 (Success Green):** Maximum field extension
**Field Strength Calculation:**
```
Field Strength = min(3.0, Mahalanobis Distance × Tensor Intensity)
```
The field amplitude adjusts to ATR and mathematical distance, creating dynamic zones that respond to market volatility.
**Radiation Line Network:**
During active tensor states, the system projects directional radiation lines showing field energy distribution:
- **8 Directional Rays:** Complete angular coverage
- **Tapering Segments:** Progressive transparency for natural visual flow
- **Pulse Effects:** Enhanced visualization during volatility jumps
### Dimensional Portal System
**Portal Mathematics:**
Dimensional portals visualize regime transitions using category theory principles:
- **Green Portals (◉):** Trending regime detection (appear below price for support)
- **Red Portals (◎):** Mean-reverting regime (appear above price for resistance)
- **Yellow Portals (○):** Random walk regime (neutral positioning)
**Tensor Trail Effects:**
Each portal generates 8 trailing particles showing mathematical momentum:
- **Large Particles (●):** Strong mathematical signal
- **Medium Particles (◦):** Moderate signal strength
- **Small Particles (·):** Weak signal continuation
- **Micro Particles (˙):** Signal dissipation
### Information Flow Streams
**Particle Stream Visualization:**
Transfer entropy creates flowing particle streams indicating information direction:
- **Upward Streams:** Volume leading price (accumulation phases)
- **Downward Streams:** Price leading volume (distribution phases)
- **Stream Density:** Proportional to information flow strength
**15-Particle Evolution:**
Each stream contains 15 particles with progressive sizing and transparency, creating natural flow visualization that makes information transfer immediately apparent.
### Fractal Matrix Grid System
**Multi-Timeframe Fractal Levels:**
The system calculates and displays fractal highs/lows across five Fibonacci periods:
- **8-Period:** Short-term fractal structure
- **13-Period:** Intermediate-term patterns
- **21-Period:** Primary swing levels
- **34-Period:** Major structural levels
- **55-Period:** Long-term fractal boundaries
**Triple-Layer Visualization:**
Each fractal level uses three-layer rendering:
- **Shadow Layer:** Widest, darkest foundation (width 5)
- **Glow Layer:** Medium white core line (width 3)
- **Tensor Layer:** Dotted mathematical overlay (width 1)
**Intelligent Labeling System:**
Smart spacing prevents label overlap using ATR-based minimum distances. Labels include:
- **Fractal Period:** Time-based identification
- **Topological Class:** Mathematical complexity rating (0, I, II, III)
- **Price Level:** Exact fractal price
- **Mahalanobis Distance:** Current mathematical field strength
- **Hurst Exponent:** Current regime classification
- **Anomaly Indicators:** Visual strength representations (○ ◐ ● ⚡)
### Wick Pressure Analysis
**Rejection Level Mathematics:**
The system analyzes candle wick patterns to project future pressure zones:
- **Upper Wick Analysis:** Identifies selling pressure and resistance zones
- **Lower Wick Analysis:** Identifies buying pressure and support zones
- **Pressure Projection:** Extends lines forward based on mathematical probability
**Multi-Layer Glow Effects:**
Wick pressure lines use progressive transparency (1-8 layers) creating natural glow effects that make pressure zones immediately visible without cluttering the chart.
### Enhanced Regime Background
**Dynamic Intensity Mapping:**
Background colors reflect mathematical regime strength:
- **Deep Transparency (98% alpha):** Subtle regime indication
- **Pulse Intensity:** Based on regime strength calculation
- **Color Coding:** Green (trending), Red (mean-reverting), Neutral (random)
**Smoothing Integration:**
Regime changes incorporate 10-bar smoothing to prevent background flicker while maintaining responsiveness to genuine regime shifts.
### Color Scheme System
**Six Professional Themes:**
- **Dark (Default):** Professional trading environment optimization
- **Light:** High ambient light conditions
- **Classic:** Traditional technical analysis appearance
- **Neon:** High-contrast visibility for active trading
- **Neutral:** Minimal distraction focus
- **Bright:** Maximum visibility for complex setups
Each theme maintains mathematical accuracy while optimizing visual clarity for different trading environments and personal preferences.
---
## 📊 INSTITUTIONAL-GRADE DASHBOARD
### Tensor Field Status Section
**Field Strength Display:**
Real-time Mahalanobis distance calculation with dynamic emoji indicators:
- **⚡ (Lightning):** Extreme field strength (>1.5× threshold)
- **● (Solid Circle):** Strong field activity (>1.0× threshold)
- **○ (Open Circle):** Normal field state
**Signal Quality Rating:**
Democratic algorithm assessment:
- **ELITE:** All 3 components aligned (highest probability)
- **STRONG:** 2 components aligned (good probability)
- **GOOD:** 1 component active (moderate probability)
- **WEAK:** No clear component signals
**Threshold and Anomaly Monitoring:**
- **Threshold Display:** Current mathematical threshold setting
- **Anomaly Level (0-100%):** Combined volatility and volume spike measurement
- **>70%:** High anomaly (red warning)
- **30-70%:** Moderate anomaly (orange caution)
- **<30%:** Normal conditions (green confirmation)
### Tensor State Analysis Section
**Mathematical State Classification:**
- **↑ BULL (Tensor State +1):** Trending regime with bullish bias
- **↓ BEAR (Tensor State -1):** Mean-reverting regime with bearish bias
- **◈ SUPER (Tensor State 0):** Random walk regime (neutral)
**Visual State Gauge:**
Five-circle progression showing tensor field polarity:
- **🟢🟢🟢⚪⚪:** Strong bullish mathematical alignment
- **⚪⚪🟡⚪⚪:** Neutral/transitional state
- **⚪⚪🔴🔴🔴:** Strong bearish mathematical alignment
**Trend Direction and Phase Analysis:**
- **📈 BULL / 📉 BEAR / ➡️ NEUTRAL:** Primary trend classification
- **🌪️ CHAOS:** Extreme information flow (>2.0 flow strength)
- **⚡ ACTIVE:** Strong information flow (1.0-2.0 flow strength)
- **😴 CALM:** Low information flow (<1.0 flow strength)
### Trading Signals Section
**Real-Time Signal Status:**
- **🟢 ACTIVE / ⚪ INACTIVE:** Long signal availability
- **🔴 ACTIVE / ⚪ INACTIVE:** Short signal availability
- **Components (X/3):** Active algorithmic components
- **Mode Display:** Current signal generation mode
**Signal Strength Visualization:**
Color-coded component count:
- **Green:** 3/3 components (maximum confidence)
- **Aqua:** 2/3 components (good confidence)
- **Orange:** 1/3 components (moderate confidence)
- **Gray:** 0/3 components (no signals)
### Performance Metrics Section
**Win Rate Monitoring:**
Estimated win rates based on signal quality with emoji indicators:
- **🔥 (Fire):** ≥60% estimated win rate
- **👍 (Thumbs Up):** 45-59% estimated win rate
- **⚠️ (Warning):** <45% estimated win rate
**Mathematical Metrics:**
- **Hurst Exponent:** Real-time fractal dimension (0.000-1.000)
- **Information Flow:** Volume/price leading indicators
- **📊 VOL:** Volume leading price (accumulation/distribution)
- **💰 PRICE:** Price leading volume (momentum/speculation)
- **➖ NONE:** Balanced information flow
- **Volatility Classification:**
- **🔥 HIGH:** Above 1.5× jump threshold
- **📊 NORM:** Normal volatility range
- **😴 LOW:** Below 0.5× jump threshold
### Market Structure Section (Large Dashboard)
**Regime Classification:**
- **📈 TREND:** Hurst >0.6, momentum strategies optimal
- **🔄 REVERT:** Hurst <0.4, contrarian strategies optimal
- **🎲 RANDOM:** Hurst ≈0.5, breakout strategies preferred
**Mathematical Field Analysis:**
- **Dimensions:** Current volatility space complexity (2D-5D)
- **Hawkes λ (Lambda):** Self-exciting jump intensity (0.00-1.00)
- **Jump Status:** 🚨 JUMP (active) / ✅ NORM (normal)
### Settings Summary Section (Large Dashboard)
**Active Configuration Display:**
- **Sensitivity:** Current master sensitivity setting
- **Lookback:** Primary analysis window
- **Theme:** Active color scheme
- **Method:** Hurst calculation method (Classic R/S, Adaptive R/S, DFA)
**Dashboard Sizing Options:**
- **Small:** Essential metrics only (mobile/small screens)
- **Normal:** Balanced information density (standard desktop)
- **Large:** Maximum detail (multi-monitor setups)
**Position Options:**
- **Top Right:** Standard placement (avoids price action)
- **Top Left:** Wide chart optimization
- **Bottom Right:** Recent price focus (scalping)
- **Bottom Left:** Maximum price visibility (swing trading)
---
## 🎯 SIGNAL GENERATION LOGIC
### Multi-Component Convergence System
**Component Signal Architecture:**
The TMAE generates signals through sophisticated component analysis rather than simple threshold crossing:
**Volatility Component:**
- **Jump Detection:** Mahalanobis distance threshold breach
- **Hawkes Intensity:** Self-exciting process activation (>0.2)
- **Multi-dimensional:** Considers all volatility dimensions simultaneously
**Hurst Regime Component:**
- **Trending Markets:** Price above SMA-20 with positive momentum
- **Mean-Reverting Markets:** Price at Bollinger Band extremes
- **Random Markets:** Bollinger squeeze breakouts with directional confirmation
**Transfer Entropy Component:**
- **Volume Leadership:** Information flow from volume to price
- **Volume Spike:** Volume 110%+ above 20-period average
- **Flow Significance:** Above entropy threshold with directional bias
### Democratic Signal Weighting
**Signal Mode Implementation:**
- **Aggressive Mode:** Any single component triggers signal
- **Confluence Mode:** Minimum 2 components must agree
- **Conservative Mode:** All 3 components must align
**Momentum Confirmation:**
All signals require momentum confirmation:
- **Long Signals:** RSI >50 AND price >EMA-9
- **Short Signals:** RSI <50 AND price 0.6):**
- **Increase Sensitivity:** Catch momentum continuation
- **Lower Mean Reversion Threshold:** Avoid counter-trend signals
- **Emphasize Volume Leadership:** Institutional accumulation/distribution
- **Tensor Field Focus:** Use expansion for trend continuation
- **Signal Mode:** Aggressive or Confluence for trend following
**Range-Bound Markets (Hurst <0.4):**
- **Decrease Sensitivity:** Avoid false breakouts
- **Lower Trending Threshold:** Quick regime recognition
- **Focus on Price Leadership:** Retail sentiment extremes
- **Fractal Grid Emphasis:** Support/resistance trading
- **Signal Mode:** Conservative for high-probability reversals
**Volatile Markets (High Jump Frequency):**
- **Increase Hawkes Decay:** Recognize event clustering
- **Higher Jump Threshold:** Avoid noise signals
- **Maximum Dimensions:** Capture full volatility complexity
- **Reduce Position Sizing:** Risk management adaptation
- **Enhanced Visuals:** Maximum information for rapid decisions
**Low Volatility Markets (Low Jump Frequency):**
- **Decrease Jump Threshold:** Capture subtle movements
- **Lower Hawkes Decay:** Treat moves as independent
- **Reduce Dimensions:** Simplify analysis
- **Increase Position Sizing:** Capitalize on compressed volatility
- **Minimal Visuals:** Reduce distraction in quiet markets
---
## 🚀 ADVANCED TRADING STRATEGIES
### The Mathematical Convergence Method
**Entry Protocol:**
1. **Fractal Grid Approach:** Monitor price approaching significant fractal levels
2. **Tensor Field Confirmation:** Verify field expansion supporting direction
3. **Portal Signal:** Wait for dimensional portal appearance
4. **ELITE/STRONG Quality:** Only trade highest quality mathematical signals
5. **Component Consensus:** Confirm 2+ components agree in Confluence mode
**Example Implementation:**
- Price approaching 21-period fractal high
- Tensor field expanding upward (bullish mathematical alignment)
- Green portal appears below price (trending regime confirmation)
- ELITE quality signal with 3/3 components active
- Enter long position with stop below fractal level
**Risk Management:**
- **Stop Placement:** Below/above fractal level that generated signal
- **Position Sizing:** Based on Mahalanobis distance (higher distance = smaller size)
- **Profit Targets:** Next fractal level or tensor field resistance
### The Regime Transition Strategy
**Regime Change Detection:**
1. **Monitor Hurst Exponent:** Watch for persistent moves above/below thresholds
2. **Portal Color Change:** Regime transitions show different portal colors
3. **Background Intensity:** Increasing regime background intensity
4. **Mathematical Confirmation:** Wait for regime confirmation (hysteresis)
**Trading Implementation:**
- **Trending Transitions:** Trade momentum breakouts, follow trend
- **Mean Reversion Transitions:** Trade range boundaries, fade extremes
- **Random Transitions:** Trade breakouts with tight stops
**Advanced Techniques:**
- **Multi-Timeframe:** Confirm regime on higher timeframe
- **Early Entry:** Enter on regime transition rather than confirmation
- **Regime Strength:** Larger positions during strong regime signals
### The Information Flow Momentum Strategy
**Flow Detection Protocol:**
1. **Monitor Transfer Entropy:** Watch for significant information flow shifts
2. **Volume Leadership:** Strong edge when volume leads price
3. **Flow Acceleration:** Increasing flow strength indicates momentum
4. **Directional Confirmation:** Ensure flow aligns with intended trade direction
**Entry Signals:**
- **Volume → Price Flow:** Enter during accumulation/distribution phases
- **Price → Volume Flow:** Enter on momentum confirmation breaks
- **Flow Reversal:** Counter-trend entries when flow reverses
**Optimization:**
- **Scalping:** Use immediate flow detection (2-5 bar lag)
- **Swing Trading:** Use structural flow (10-20 bar lag)
- **Multi-Asset:** Compare flow between correlated assets
### The Tensor Field Expansion Strategy
**Field Mathematics:**
The tensor field expansion indicates mathematical pressure building in market structure:
**Expansion Phases:**
1. **Compression:** Field contracts, volatility decreases
2. **Tension Building:** Mathematical pressure accumulates
3. **Expansion:** Field expands rapidly with directional movement
4. **Resolution:** Field stabilizes at new equilibrium
**Trading Applications:**
- **Compression Trading:** Prepare for breakout during field contraction
- **Expansion Following:** Trade direction of field expansion
- **Reversion Trading:** Fade extreme field expansion
- **Multi-Dimensional:** Consider all field layers for confirmation
### The Hawkes Process Event Strategy
**Self-Exciting Jump Trading:**
Understanding that market shocks cluster and create follow-on opportunities:
**Jump Sequence Analysis:**
1. **Initial Jump:** First volatility jump detected
2. **Clustering Phase:** Hawkes intensity remains elevated
3. **Follow-On Opportunities:** Additional jumps more likely
4. **Decay Period:** Intensity gradually decreases
**Implementation:**
- **Jump Confirmation:** Wait for mathematical jump confirmation
- **Direction Assessment:** Use other components for direction
- **Clustering Trades:** Trade subsequent moves during high intensity
- **Decay Exit:** Exit positions as Hawkes intensity decays
### The Fractal Confluence System
**Multi-Timeframe Fractal Analysis:**
Combining fractal levels across different periods for high-probability zones:
**Confluence Zones:**
- **Double Confluence:** 2 fractal levels align
- **Triple Confluence:** 3+ fractal levels cluster
- **Mathematical Confirmation:** Tensor field supports the level
- **Information Flow:** Transfer entropy confirms direction
**Trading Protocol:**
1. **Identify Confluence:** Find 2+ fractal levels within 1 ATR
2. **Mathematical Support:** Verify tensor field alignment
3. **Signal Quality:** Wait for STRONG or ELITE signal
4. **Risk Definition:** Use fractal level for stop placement
5. **Profit Targeting:** Next major fractal confluence zone
---
## ⚠️ COMPREHENSIVE RISK MANAGEMENT
### Mathematical Position Sizing
**Mahalanobis Distance Integration:**
Position size should inversely correlate with mathematical field strength:
```
Position Size = Base Size × (Threshold / Mahalanobis Distance)
```
**Risk Scaling Matrix:**
- **Low Field Strength (<2.0):** Standard position sizing
- **Moderate Field Strength (2.0-3.0):** 75% position sizing
- **High Field Strength (3.0-4.0):** 50% position sizing
- **Extreme Field Strength (>4.0):** 25% position sizing or no trade
### Signal Quality Risk Adjustment
**Quality-Based Position Sizing:**
- **ELITE Signals:** 100% of planned position size
- **STRONG Signals:** 75% of planned position size
- **GOOD Signals:** 50% of planned position size
- **WEAK Signals:** No position or paper trading only
**Component Agreement Scaling:**
- **3/3 Components:** Full position size
- **2/3 Components:** 75% position size
- **1/3 Components:** 50% position size or skip trade
### Regime-Adaptive Risk Management
**Trending Market Risk:**
- **Wider Stops:** Allow for trend continuation
- **Trend Following:** Trade with regime direction
- **Higher Position Size:** Trend probability advantage
- **Momentum Stops:** Trail stops based on momentum indicators
**Mean-Reverting Market Risk:**
- **Tighter Stops:** Quick exits on trend continuation
- **Contrarian Positioning:** Trade against extremes
- **Smaller Position Size:** Higher reversal failure rate
- **Level-Based Stops:** Use fractal levels for stops
**Random Market Risk:**
- **Breakout Focus:** Trade only clear breakouts
- **Tight Initial Stops:** Quick exit if breakout fails
- **Reduced Frequency:** Skip marginal setups
- **Range-Based Targets:** Profit targets at range boundaries
### Volatility-Adaptive Risk Controls
**High Volatility Periods:**
- **Reduced Position Size:** Account for wider price swings
- **Wider Stops:** Avoid noise-based exits
- **Lower Frequency:** Skip marginal setups
- **Faster Exits:** Take profits more quickly
**Low Volatility Periods:**
- **Standard Position Size:** Normal risk parameters
- **Tighter Stops:** Take advantage of compressed ranges
- **Higher Frequency:** Trade more setups
- **Extended Targets:** Allow for compressed volatility expansion
### Multi-Timeframe Risk Alignment
**Higher Timeframe Trend:**
- **With Trend:** Standard or increased position size
- **Against Trend:** Reduced position size or skip
- **Neutral Trend:** Standard position size with tight management
**Risk Hierarchy:**
1. **Primary:** Current timeframe signal quality
2. **Secondary:** Higher timeframe trend alignment
3. **Tertiary:** Mathematical field strength
4. **Quaternary:** Market regime classification
---
## 📚 EDUCATIONAL VALUE AND MATHEMATICAL CONCEPTS
### Advanced Mathematical Concepts
**Tensor Analysis in Markets:**
The TMAE introduces traders to tensor analysis, a branch of mathematics typically reserved for physics and advanced engineering. Tensors provide a framework for understanding multi-dimensional market relationships that scalar and vector analysis cannot capture.
**Information Theory Applications:**
Transfer entropy implementation teaches traders about information flow in markets, a concept from information theory that quantifies directional causality between variables. This provides intuition about market microstructure and participant behavior.
**Fractal Geometry in Trading:**
The Hurst exponent calculation exposes traders to fractal geometry concepts, helping understand that markets exhibit self-similar patterns across multiple timeframes. This mathematical insight transforms how traders view market structure.
**Stochastic Process Theory:**
The Hawkes process implementation introduces concepts from stochastic process theory, specifically self-exciting point processes. This provides mathematical framework for understanding why market events cluster and exhibit memory effects.
### Learning Progressive Complexity
**Beginner Mathematical Concepts:**
- **Volatility Dimensions:** Understanding multi-dimensional analysis
- **Regime Classification:** Learning market personality types
- **Signal Democracy:** Algorithmic consensus building
- **Visual Mathematics:** Interpreting mathematical concepts visually
**Intermediate Mathematical Applications:**
- **Mahalanobis Distance:** Statistical distance in multi-dimensional space
- **Rescaled Range Analysis:** Fractal dimension measurement
- **Information Entropy:** Quantifying uncertainty and causality
- **Field Theory:** Understanding mathematical fields in market context
**Advanced Mathematical Integration:**
- **Tensor Field Dynamics:** Multi-dimensional market force analysis
- **Stochastic Self-Excitation:** Event clustering and memory effects
- **Categorical Composition:** Mathematical signal combination theory
- **Topological Market Analysis:** Understanding market shape and connectivity
### Practical Mathematical Intuition
**Developing Market Mathematics Intuition:**
The TMAE serves as a bridge between abstract mathematical concepts and practical trading applications. Traders develop intuitive understanding of:
- **How markets exhibit mathematical structure beneath apparent randomness**
- **Why multi-dimensional analysis reveals patterns invisible to single-variable approaches**
- **How information flows through markets in measurable, predictable ways**
- **Why mathematical models provide probabilistic edges rather than certainties**
---
## 🔬 IMPLEMENTATION AND OPTIMIZATION
### Getting Started Protocol
**Phase 1: Observation (Week 1)**
1. **Apply with defaults:** Use standard settings on your primary trading timeframe
2. **Study visual elements:** Learn to interpret tensor fields, portals, and streams
3. **Monitor dashboard:** Observe how metrics change with market conditions
4. **No trading:** Focus entirely on pattern recognition and understanding
**Phase 2: Pattern Recognition (Week 2-3)**
1. **Identify signal patterns:** Note what market conditions produce different signal qualities
2. **Regime correlation:** Observe how Hurst regimes affect signal performance
3. **Visual confirmation:** Learn to read tensor field expansion and portal signals
4. **Component analysis:** Understand which components drive signals in different markets
**Phase 3: Parameter Optimization (Week 4-5)**
1. **Asset-specific tuning:** Adjust parameters for your specific trading instrument
2. **Timeframe optimization:** Fine-tune for your preferred trading timeframe
3. **Sensitivity adjustment:** Balance signal frequency with quality
4. **Visual customization:** Optimize colors and intensity for your trading environment
**Phase 4: Live Implementation (Week 6+)**
1. **Paper trading:** Test signals with hypothetical trades
2. **Small position sizing:** Begin with minimal risk during learning phase
3. **Performance tracking:** Monitor actual vs. expected signal performance
4. **Continuous optimization:** Refine settings based on real performance data
### Performance Monitoring System
**Signal Quality Tracking:**
- **ELITE Signal Win Rate:** Track highest quality signals separately
- **Component Performance:** Monitor which components provide best signals
- **Regime Performance:** Analyze performance across different market regimes
- **Timeframe Analysis:** Compare performance across different session times
**Mathematical Metric Correlation:**
- **Field Strength vs. Performance:** Higher field strength should correlate with better performance
- **Component Agreement vs. Win Rate:** More component agreement should improve win rates
- **Regime Alignment vs. Success:** Trading with mathematical regime should outperform
### Continuous Optimization Process
**Monthly Review Protocol:**
1. **Performance Analysis:** Review win rates, profit factors, and maximum drawdown
2. **Parameter Assessment:** Evaluate if current settings remain optimal
3. **Market Adaptation:** Adjust for changes in market character or volatility
4. **Component Weighting:** Consider if certain components should receive more/less emphasis
**Quarterly Deep Analysis:**
1. **Mathematical Model Validation:** Verify that mathematical relationships remain valid
2. **Regime Distribution:** Analyze time spent in different market regimes
3. **Signal Evolution:** Track how signal characteristics change over time
4. **Correlation Analysis:** Monitor correlations between different mathematical components
---
## 🌟 UNIQUE INNOVATIONS AND CONTRIBUTIONS
### Revolutionary Mathematical Integration
**First-Ever Implementations:**
1. **Multi-Dimensional Volatility Tensor:** First indicator to implement true tensor analysis for market volatility
2. **Real-Time Hawkes Process:** First trading implementation of self-exciting point processes
3. **Transfer Entropy Trading Signals:** First practical application of information theory for trade generation
4. **Democratic Component Voting:** First algorithmic consensus system for signal generation
5. **Fractal-Projected Signal Quality:** First system to predict signal quality at future price levels
### Advanced Visualization Innovations
**Mathematical Visualization Breakthroughs:**
- **Tensor Field Radiation:** Visual representation of mathematical field energy
- **Dimensional Portal System:** Category theory visualization for regime transitions
- **Information Flow Streams:** Real-time visual display of market information transfer
- **Multi-Layer Fractal Grid:** Intelligent spacing and projection system
- **Regime Intensity Mapping:** Dynamic background showing mathematical regime strength
### Practical Trading Innovations
**Trading System Advances:**
- **Quality-Weighted Signal Generation:** Signals rated by mathematical confidence
- **Regime-Adaptive Strategy Selection:** Automatic strategy optimization based on market personality
- **Anti-Spam Signal Protection:** Mathematical prevention of signal clustering
- **Component Performance Tracking:** Real-time monitoring of algorithmic component success
- **Field-Strength Position Sizing:** Mathematical volatility integration for risk management
---
## ⚖️ RESPONSIBLE USAGE AND LIMITATIONS
### Mathematical Model Limitations
**Understanding Model Boundaries:**
While the TMAE implements sophisticated mathematical concepts, traders must understand fundamental limitations:
- **Markets Are Not Purely Mathematical:** Human psychology, news events, and fundamental factors create unpredictable elements
- **Past Performance Limitations:** Mathematical relationships that worked historically may not persist indefinitely
- **Model Risk:** Complex models can fail during unprecedented market conditions
- **Overfitting Potential:** Highly optimized parameters may not generalize to future market conditions
### Proper Implementation Guidelines
**Risk Management Requirements:**
- **Never Risk More Than 2% Per Trade:** Regardless of signal quality
- **Diversification Mandatory:** Don't rely solely on mathematical signals
- **Position Sizing Discipline:** Use mathematical field strength for sizing, not confidence
- **Stop Loss Non-Negotiable:** Every trade must have predefined risk parameters
**Realistic Expectations:**
- **Mathematical Edge, Not Certainty:** The indicator provides probabilistic advantages, not guaranteed outcomes
- **Learning Curve Required:** Complex mathematical concepts require time to master
- **Market Adaptation Necessary:** Parameters must evolve with changing market conditions
- **Continuous Education Important:** Understanding underlying mathematics improves application
### Ethical Trading Considerations
**Market Impact Awareness:**
- **Information Asymmetry:** Advanced mathematical analysis may provide advantages over other market participants
- **Position Size Responsibility:** Large positions based on mathematical signals can impact market structure
- **Sharing Knowledge:** Consider educational contributions to trading community
- **Fair Market Participation:** Use mathematical advantages responsibly within market framework
### Professional Development Path
**Skill Development Sequence:**
1. **Basic Mathematical Literacy:** Understand fundamental concepts before advanced application
2. **Risk Management Mastery:** Develop disciplined risk control before relying on complex signals
3. **Market Psychology Understanding:** Combine mathematical analysis with behavioral market insights
4. **Continuous Learning:** Stay updated on mathematical finance developments and market evolution
---
## 🔮 CONCLUSION
The Tensor Market Analysis Engine represents a quantum leap forward in technical analysis, successfully bridging the gap between advanced pure mathematics and practical trading applications. By integrating multi-dimensional volatility analysis, fractal market theory, and information flow dynamics, the TMAE reveals market structure invisible to conventional analysis while maintaining visual clarity and practical usability.
### Mathematical Innovation Legacy
This indicator establishes new paradigms in technical analysis:
- **Tensor analysis for market volatility understanding**
- **Stochastic self-excitation for event clustering prediction**
- **Information theory for causality-based trade generation**
- **Democratic algorithmic consensus for signal quality enhancement**
- **Mathematical field visualization for intuitive market understanding**
### Practical Trading Revolution
Beyond mathematical innovation, the TMAE transforms practical trading:
- **Quality-rated signals replace binary buy/sell decisions**
- **Regime-adaptive strategies automatically optimize for market personality**
- **Multi-dimensional risk management integrates mathematical volatility measures**
- **Visual mathematical concepts make complex analysis immediately interpretable**
- **Educational value creates lasting improvement in trading understanding**
### Future-Proof Design
The mathematical foundations ensure lasting relevance:
- **Universal mathematical principles transcend market evolution**
- **Multi-dimensional analysis adapts to new market structures**
- **Regime detection automatically adjusts to changing market personalities**
- **Component democracy allows for future algorithmic additions**
- **Mathematical visualization scales with increasing market complexity**
### Commitment to Excellence
The TMAE represents more than an indicator—it embodies a philosophy of bringing rigorous mathematical analysis to trading while maintaining practical utility and visual elegance. Every component, from the multi-dimensional tensor fields to the democratic signal generation, reflects a commitment to mathematical accuracy, trading practicality, and educational value.
### Trading with Mathematical Precision
In an era where markets grow increasingly complex and computational, the TMAE provides traders with mathematical tools previously available only to institutional quantitative research teams. Yet unlike academic mathematical models, the TMAE translates complex concepts into intuitive visual representations and practical trading signals.
By combining the mathematical rigor of tensor analysis, the statistical power of multi-dimensional volatility modeling, and the information-theoretic insights of transfer entropy, traders gain unprecedented insight into market structure and dynamics.
### Final Perspective
Markets, like nature, exhibit profound mathematical beauty beneath apparent chaos. The Tensor Market Analysis Engine serves as a mathematical lens that reveals this hidden order, transforming how traders perceive and interact with market structure.
Through mathematical precision, visual elegance, and practical utility, the TMAE empowers traders to see beyond the noise and trade with the confidence that comes from understanding the mathematical principles governing market behavior.
Trade with mathematical insight. Trade with the power of tensors. Trade with the TMAE.
*"In mathematics, you don't understand things. You just get used to them." - John von Neumann*
*With the TMAE, mathematical market understanding becomes not just possible, but intuitive.*
— Dskyz, Trade with insight. Trade with anticipation.

Smarter Money Flow Divergence Detector [PhenLabs]📊 Smarter Money Flow Divergence Detector
Version: PineScript™ v6
📌 Description
SMFD was developed to help give you guys a better ability to “read” what is going on behind the scenes without directly having access to that level of data. SMFD is an enhanced divergence detection indicator that identifies money flow patterns from advanced volume analysis and price action correspondence. The detection portion of this indicator combines intelligent money flow calculations with multi timeframe volume analysis to help you see hidden accumulation and distribution phases before major price movements occur.
The indicator measures institutional trading activity by looking at volume surges, price volume dynamics, and the factors of momentum to construct an overall picture of market sentiment. It’s built to assist traders in identifying high probability entries by identifying if smart money is positioning against price action.
🚀 Points of Innovation
● Advanced Smart Money Flow algorithm with volume spike detection and large trade weighting
● Multi timeframe volume analysis for enhanced institutional activity detection
● Dynamic overbought/oversold zones that adapt to current market conditions
● Enhanced divergence detection with pivot confirmation and strength validation
● Color themes with customizable visual styling options
● Real time institutional bias tracking through accumulation/distribution analysis
🔧 Core Components
● Smart Money Flow Calculation: Combines price momentum, volume expansion, and VWAP analysis
● Institutional Bias Oscillator: Tracks accumulation/distribution patterns with volume pressure analysis
● Enhanced Divergence Engine: Detects bullish/bearish divergences with multiple confirmation factors
● Dynamic Zone Detection: Automatically adjusts overbought/oversold levels based on market volatility
● Volume Pressure Analysis: Measures buying vs selling pressure over configurable periods
● Multi factor Signal System: Generates entries with trend alignment and strength validation
🔥 Key Features
● Smart Money Flow Period: Configurable calculation period for institutional activity detection
● Volume Spike Threshold: Adjustable multiplier for detecting unusual institutional volume
● Large Trade Weight: Emphasis factor for high volume periods in flow calculations
● Pivot Detection: Customizable lookback period for accurate divergence identification
● Signal Sensitivity: Three tier system (Conservative/Medium/Aggressive) for signal generation
● Themes: Four color schemes optimized for different chart backgrounds
🎨 Visualization
● Main Oscillator: Line, Area, or Histogram display styles with dynamic color coding
● Institutional Bias Line: Real time tracking of accumulation/distribution phases
● Dynamic Zones: Adaptive overbought/oversold boundaries with gradient fills
● Divergence Lines: Automatic drawing of bullish/bearish divergence connections
● Entry Signals: Clear BUY/SELL labels with signal strength indicators
● Information Panel: Real time statistics and status updates in customizable positions
📖 Usage Guidelines
Algorithm Settings
● Smart Money Flow Period
○ Default: 20
○ Range: 5-100
○ Description: Controls the calculation period for institutional flow analysis.
Higher values provide smoother signals but reduce responsiveness to recent activity
● Volume Spike Threshold
○ Default: 1.8
○ Range: 1.0-5.0
○ Description: Multiplier for detecting unusual volume activity indicating institutional participation. Higher values require more extreme volume for detection
● Large Trade Weight
○ Default: 2.5
○ Range: 1.5-5.0
○ Description: Weight applied to high volume periods in smart money calculations. Increases emphasis on institutional sized transactions
Divergence Detection
● Pivot Detection Period
○ Default: 12
○ Range: 5-50
○ Description: Bars to analyze for pivot high/low identification.
Affects divergence accuracy and signal frequency
● Minimum Divergence Strength
○ Default: 0.25
○ Range: 0.1-1.0
○ Description: Required price change percentage for valid divergence patterns.
Higher values filter out weaker signals
✅ Best Use Cases
● Trading with intraday to daily timeframes for institutional position identification
● Confirming trend reversals when divergences align with support/resistance levels
● Entry timing in trending markets when institutional bias supports the direction
● Risk management by avoiding trades against strong institutional positioning
● Multi timeframe analysis combining short term signals with longer term bias
⚠️ Limitations
● Requires sufficient volume for accurate institutional detection in low volume markets
● Divergence signals may have false positives during highly volatile news events
● Best performance on liquid markets with consistent institutional participation
● Lagging nature of volume based calculations may delay signal generation
● Effectiveness reduced during low participation holiday periods
💡 What Makes This Unique
● Multi Factor Analysis: Combines volume, price, and momentum for comprehensive institutional detection
● Adaptive Zones: Dynamic overbought/oversold levels that adjust to market conditions
● Volume Intelligence: Advanced algorithms identify institutional sized transactions
● Professional Visualization: Multiple display styles with customizable themes
● Confirmation System: Multiple validation layers reduce false signal generation
🔬 How It Works
1. Volume Analysis Phase:
● Analyzes current volume against historical averages to identify institutional activity
● Applies multi timeframe analysis for enhanced detection accuracy
● Calculates volume pressure through buying vs selling momentum
2. Smart Money Flow Calculation:
● Combines typical price with volume weighted analysis
● Applies institutional trade weighting for high volume periods
● Generates directional flow based on price momentum and volume expansion
3. Divergence Detection Process:
● Identifies pivot highs/lows in both price and indicator values
● Validates divergence strength against minimum threshold requirements
● Confirms signals through multiple technical factors before generation
💡 Note: This indicator works best when combined with proper risk management and position sizing. The institutional bias component helps identify market sentiment shifts, while divergence signals provide specific entry opportunities. For optimal results, use on liquid markets with consistent institutional participation and combine with additional technical analysis methods.

MTF Pivot Fib Speed Resistance FansOverview
This Pine Script indicator, titled "MTF Pivot Fib Speed Resistance Fans", is a multi-timeframe tool that automatically plots Fib Speed Resistance Fan lines based on pivot structures derived from higher timeframes. It mirrors the functionality of TradingView’s built-in “Fib Speed Resistance Fan” drawing tool, but in a dynamic, programmatic way. It uses pivot highs and lows to anchor fan projections, drawing forward-facing trend lines that align with well-known Fibonacci ratios and their extensions.
Pivot Detection Logic
The script identifies pivots by comparing the current bar’s high and low against the highest and lowest prices over a user-defined pivot period. This pivot detection occurs on a higher timeframe of your choice, giving a broader and more strategic view of price structure. The script tracks direction changes in the pivot trend and stores only the most recent few pivots to maintain clean and meaningful fan drawings.
Fan Direction Control
The user can select whether to draw fans for "Buys", "Sells", or "Both". The script only draws fan lines when a new directional move is detected based on the pivot structure and the selected bias. For example, in “Buys” mode, a rising pivot followed by another higher low will trigger upward fan projections.
Fib Speed Resistance Levels
Once two pivots are identified, the script draws multiple fan lines from the first pivot outward, at angles defined by a preset list of Fibonacci levels. These fan lines help visualize speed and strength of a price move.
The script also draws a horizontal line from the pivot for additional confluence at the base level (1.0).
Price Level Plotting
In addition to drawing fan lines, the indicator also plots their price levels on the right-hand price scale. This makes it easier for users to visually reference the projected support and resistance levels without needing to trace the lines manually across the chart.
Mapping to TradingView’s "Fib Speed Resistance Fan"
The expanded set of values used in this script is not arbitrary—they closely align with the default and extended levels available in TradingView's built-in "Fib Speed Resistance Fan" tool.
TradingView’s Fib Fan tool offers several levels by default, including traditional Fibonacci ratios like 0.382, 0.5, 0.618, and 1. However, if you right-click the tool and open its settings, you’ll find additional toggles for levels like 1.618, 2.000, 2.618, and even 4.000. These deeper levels are used to project stronger trend continuations beyond the standard retracement zones.
The inclusion of levels such as 0.25, 0.75, and 1.34 reflects configurations that are available when you manually add or customize levels in TradingView’s fan tool. While 1.34 is not a canonical Fibonacci ratio, it is often found in hybrid Gann/Fib methods and is included in some preset templates in TradingView’s drawing tool for advanced users.
By incorporating these levels directly into the Pine Script, the indicator faithfully reproduces the fan structure users would manually draw using TradingView’s graphical Fib Fan tool—but does so programmatically, dynamically, and with multi-timeframe control. This eliminates manual errors, allows for responsive updating, and adds custom visual tracking via the price scale.
These values are standardized within the context of TradingView's Fib Fan tool and not made up. This script automates what the manual drawing tool achieves, with added precision and flexibility.

MACD Full [Titans_Invest]MACD Full — A Smarter, More Flexible MACD.
Looking for a MACD with real customization power?
We present one of the most complete public MACD indicators available on TradingView.
It maintains the classic MACD structure but is enhanced with 20 fully customizable long entry conditions and 20 short entry conditions , giving you precise control over your strategy.
Plus, it’s fully automation-ready, making it ideal for quantitative systems and algorithmic trading.
Whether you're a discretionary trader or a bot developer, this tool is built to seamlessly adapt to your style.
⯁ WHAT IS THE MACD❓
The Moving Average Convergence Divergence (MACD) is a technical analysis indicator developed by Gerald Appel. It measures the relationship between two moving averages of a security’s price to identify changes in momentum, direction, and strength of a trend. The MACD is composed of three components: the MACD line, the signal line, and the histogram.
⯁ HOW TO USE THE MACD❓
The MACD is calculated by subtracting the 26-period Exponential Moving Average (EMA) from the 12-period EMA. A 9-period EMA of the MACD line, called the signal line, is then plotted on top of the MACD line. The MACD histogram represents the difference between the MACD line and the signal line.
Here are the primary signals generated by the MACD:
Bullish Crossover: When the MACD line crosses above the signal line, indicating a potential buy signal.
Bearish Crossover: When the MACD line crosses below the signal line, indicating a potential sell signal.
Divergence: When the price of the security diverges from the MACD, suggesting a potential reversal.
Overbought/Oversold Conditions: Indicated by the MACD line moving far away from the signal line, though this is less common than in oscillators like the RSI.
⯁ ENTRY CONDITIONS
The conditions below are fully flexible and allow for complete customization of the signal.
______________________________________________________
🔹 CONDITIONS TO BUY 📈
______________________________________________________
• Signal Validity: The signal will remain valid for X bars .
• Signal Sequence: Configurable as AND or OR .
🔹 MACD > Signal Smoothing
🔹 MACD < Signal Smoothing
🔹 Histogram > 0
🔹 Histogram < 0
🔹 Histogram Positive
🔹 Histogram Negative
🔹 MACD > 0
🔹 MACD < 0
🔹 Signal > 0
🔹 Signal < 0
🔹 MACD > Histogram
🔹 MACD < Histogram
🔹 Signal > Histogram
🔹 Signal < Histogram
🔹 MACD (Crossover) Signal
🔹 MACD (Crossunder) Signal
🔹 MACD (Crossover) 0
🔹 MACD (Crossunder) 0
🔹 Signal (Crossover) 0
🔹 Signal (Crossunder) 0
______________________________________________________
______________________________________________________
🔸 CONDITIONS TO SELL 📉
______________________________________________________
• Signal Validity: The signal will remain valid for X bars .
• Signal Sequence: Configurable as AND or OR .
🔸 MACD > Signal Smoothing
🔸 MACD < Signal Smoothing
🔸 Histogram > 0
🔸 Histogram < 0
🔸 Histogram Positive
🔸 Histogram Negative
🔸 MACD > 0
🔸 MACD < 0
🔸 Signal > 0
🔸 Signal < 0
🔸 MACD > Histogram
🔸 MACD < Histogram
🔸 Signal > Histogram
🔸 Signal < Histogram
🔸 MACD (Crossover) Signal
🔸 MACD (Crossunder) Signal
🔸 MACD (Crossover) 0
🔸 MACD (Crossunder) 0
🔸 Signal (Crossover) 0
🔸 Signal (Crossunder) 0
______________________________________________________
______________________________________________________
🤖 AUTOMATION 🤖
• You can automate the BUY and SELL signals of this indicator.
______________________________________________________
______________________________________________________
⯁ UNIQUE FEATURES
______________________________________________________
Signal Validity: The signal will remain valid for X bars
Signal Sequence: Configurable as AND/OR
Condition Table: BUY/SELL
Condition Labels: BUY/SELL
Plot Labels in the Graph Above: BUY/SELL
Automate and Monitor Signals/Alerts: BUY/SELL
Signal Validity: The signal will remain valid for X bars
Signal Sequence: Configurable as AND/OR
Table of Conditions: BUY/SELL
Conditions Label: BUY/SELL
Plot Labels in the graph above: BUY/SELL
Automate & Monitor Signals/Alerts: BUY/SELL
______________________________________________________
📜 SCRIPT : MACD Full
🎴 Art by : @Titans_Invest & @DiFlip
👨💻 Dev by : @Titans_Invest & @DiFlip
🎑 Titans Invest — The Wizards Without Gloves 🧤
✨ Enjoy!
______________________________________________________
o Mission 🗺
• Inspire Traders to manifest Magic in the Market.
o Vision 𐓏
• To elevate collective Energy 𐓷𐓏

Heikin-Ashi Mean Reversion Oscillator [Alpha Extract]The Heikin-Ashi Mean Reversion Oscillator combines the smoothing characteristics of Heikin-Ashi candlesticks with mean reversion analysis to create a powerful momentum oscillator. This indicator applies Heikin-Ashi transformation twice - first to price data and then to the oscillator itself - resulting in smoother signals while maintaining sensitivity to trend changes and potential reversal points.
🔶 CALCULATION
Heikin-Ashi Transformation: Converts regular OHLC data to smoothed Heikin-Ashi values
Component Analysis: Calculates trend strength, body deviation, and price deviation from mean
Oscillator Construction: Combines components with weighted formula (40% trend strength, 30% body deviation, 30% price deviation)
Double Smoothing: Applies EMA smoothing and second Heikin-Ashi transformation to oscillator values
Signal Generation: Identifies trend changes and crossover points with overbought/oversold levels
Formula:
HA Close = (Open + High + Low + Close) / 4
HA Open = (Previous HA Open + Previous HA Close) / 2
Trend Strength = Normalized consecutive HA candle direction
Body Deviation = (HA Body - Mean Body) / Mean Body * 100
Price Deviation = ((HA Close - Price Mean) / Price Mean * 100) / Standard Deviation * 25
Raw Oscillator = (Trend Strength * 0.4) + (Body Deviation * 0.3) + (Price Deviation * 0.3)
Final Oscillator = 50 + (EMA(Raw Oscillator) / 2)
🔶 DETAILS Visual Features:
Heikin-Ashi Candlesticks: Smoothed oscillator representation using HA transformation with vibrant teal/red coloring
Overbought/Oversold Zones: Horizontal lines at customizable levels (default 70/30) with background highlighting in extreme zones
Moving Averages: Optional fast and slow EMA overlays for additional trend confirmation
Signal Dashboard: Real-time table showing current oscillator status (Overbought/Oversold/Bullish/Bearish) and buy/sell signals
Reference Lines: Middle line at 50 (neutral), with 0 and 100 boundaries for range visualization
Interpretation:
Above 70: Overbought conditions, potential selling opportunity
Below 30: Oversold conditions, potential buying opportunity
Bullish HA Candles: Green/teal candles indicate upward momentum
Bearish HA Candles: Red candles indicate downward momentum
MA Crossovers: Fast EMA above slow EMA suggests bullish momentum, below suggests bearish momentum
Zone Exits: Price moving out of extreme zones (above 70 or below 30) often signals trend continuation
🔶 EXAMPLES
Mean Reversion Signals: When the oscillator reaches extreme levels (above 70 or below 30), it identifies potential reversal points where price may revert to the mean.
Example: Oscillator reaching 80+ levels during strong uptrends often precedes short-term pullbacks, providing profit-taking opportunities.
Trend Change Detection: The double Heikin-Ashi smoothing helps identify genuine trend changes while filtering out market noise.
Example: When oscillator HA candles change from red to teal after oversold readings, this confirms potential trend reversal from bearish to bullish.
Moving Average Confirmation: Fast and slow EMA crossovers on the oscillator provide additional confirmation of momentum shifts.
Example: Fast EMA crossing above slow EMA while oscillator is rising from oversold levels provides strong bullish confirmation signal.
Dashboard Signal Integration: The real-time dashboard combines oscillator status with directional signals for quick decision-making.
Example: Dashboard showing "Oversold" status with "BUY" signal when HA candles turn bullish provides clear entry timing.
🔶 SETTINGS
Customization Options:
Calculation: Oscillator period (default 14), smoothing factor (1-50, default 2)
Levels: Overbought threshold (50-100, default 70), oversold threshold (0-50, default 30)
Moving Averages: Toggle display, fast EMA length (default 9), slow EMA length (default 21)
Visual Enhancements: Show/hide signal dashboard, customizable table position
Alert Conditions: Oversold bounce, overbought reversal, bullish/bearish MA crossovers
The Heikin-Ashi Mean Reversion Oscillator provides traders with a sophisticated momentum tool that combines the smoothing benefits of Heikin-Ashi analysis with mean reversion principles. The double transformation process creates cleaner signals while the integrated dashboard and multiple confirmation methods help traders identify high-probability entry and exit points during both trending and ranging market conditions.

Buysell Martingale Signal - CustomBuysell Martingale Signal - Custom Indicator
Introduction:
This indicator provides a dynamic buy and sell signal system incorporating an adaptive Martingale logic. Built upon the signalLib_yashgode9/2 library, it is designed for use across various markets and timeframes.
Key Features:
Primary Buy & Sell Signals: Identifies initial buy and sell opportunities based on directional changes derived from the signalLib.
Martingale Signals:
For Short (Sell) Positions: A Martingale Sell signal is triggered when the price moves against the existing short position by a specified stepPercent from the last entry price, indicating a potential opportunity to average down or increase position size.
For Long (Buy) Positions: Similarly, a Martingale Buy signal is triggered when the price moves against the existing long position by a stepPercent from the last entry price.
On-Chart Labels: Displays clear, customizable labels on the chart for primary Buy, Sell, Martingale Buy, and Martingale Sell signals.
Customizable Colors: Allows users to set distinct colors for primary signals and Martingale signals for better visual distinction.
Adjustable Sensitivity: Features configurable parameters (DEPTH_ENGINE, DEVIATION_ENGINE, BACKSTEP_ENGINE) to fine-tune the sensitivity of the underlying signal generation.
Webhook Support (Static Message Alerts): This indicator provides alerts with static messages for both primary and Martingale buy/sell signals. These alerts can be leveraged for automation by external systems (such as trading bots or exchange-provided Webhook Signal Trading services).
Important Note: When using these alerts for automation, an external system is required to handle the complex Martingale logic and position management (e.g., tracking steps, PnL calculation, hedging, dynamic quantity sizing), as this indicator solely focuses on signal generation and sending predefined messages.
How to Use:
Add the indicator to your desired chart.
Adjust the input parameters in the indicator's settings to match your specific trading symbol and timeframe.
For automation, you can set up TradingView alerts for the Buy Signal (Main/Martingale) and Sell Signal (Main/Martingale) conditions, pointing them to your preferred Webhook URL.
Configurable Parameters:
DEPTH_ENGINE: (e.g., 30) Controls the depth of analysis for the signal algorithm.
DEVIATION_ENGINE: (e.g., 5) Defines the allowable deviation for signal generation.
BACKSTEP_ENGINE: (e.g., 5) Specifies the number of historical bars to look back.
Martingale Step Percent: (e.g., 0.5) The percentage price movement against the current position that triggers a Martingale signal.
Labels Transparency: Adjusts the transparency of the on-chart signal labels.
Buy-Color / Sell-Color: Sets the color for primary Buy and Sell signal labels.
Martingale Buy-Color / Martingale Sell-Color: Sets the color for Martingale Buy and Sell signal labels.
Label size: Controls the visual size of the labels.
Label Offset: Adjusts the vertical offset of the labels from the candlesticks.
Risk Warning:
Financial trading inherently carries significant risk. Martingale strategies are particularly high-risk and can lead to substantial losses or even complete liquidation of capital if the market moves strongly and persistently against your position. Always backtest thoroughly and practice with a demo account, fully understanding the associated risks, before engaging with real capital.
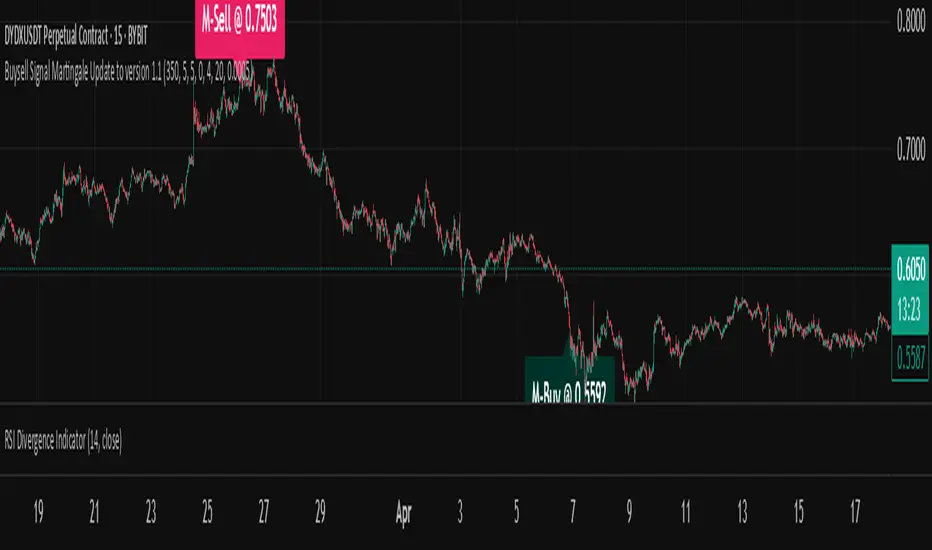
Adaptive Momentum Flow (AMF)Overview
The Adaptive Momentum Flow (AMF) indicator is a powerful, multi-faceted tool designed to provide a comprehensive and adaptive view of market momentum and trend strength. Unlike traditional oscillators with fixed settings, AMF dynamically adjusts its calculations based on market volatility , ensuring its signals remain relevant across varying market conditions. By combining advanced Double Exponential Moving Averages (DEMA) with a powerful volume analysis component and a customizable scoring system, AMF offers a unique perspective on price action and underlying buying/selling pressure.
Key Features & How It Works
1. Adaptive DEMA Trend Strength:
At its core, AMF utilizes three DEMA lines (Fast, Medium, Slow) to assess the current trend's alignment and strength.
The indicator dynamically adjusts the lengths of these DEMA lines based on real-time market volatility, measured by Average True Range (ATR). This means AMF becomes more responsive in volatile markets and smoother in calmer periods.
A "Volatility Sensitivity" input allows you to fine-tune how aggressively the indicator adapts to these changes.
2. Volume Analysis (Buying/Selling Pressure):
AMF incorporates a dedicated volume analysis module to gauge whether volume is predominantly supporting upward or downward price movements. This helps identify periods of significant buying or selling pressure.
This volume analysis component is smoothed with an adjustable Moving Average (SMA, EMA, WMA, or DEMA) and contributes to the overall momentum score, adding a crucial layer of volume-driven confirmation to the analysis.
3. Comprehensive Scoring System:
The indicator generates a normalized "Oscillator Score" that ranges from -100 to 100. This score is a weighted sum of:
Price's relationship to the Fast DEMA.
The Fast DEMA's relationship to the Medium DEMA.
The Medium DEMA's relationship to the Slow DEMA.
The smoothed value from the volume analysis.
Each component's influence on the final score can be individually adjusted via input weights, allowing for deep customization.
Signal Line & Crossovers:
A smoothed "Signal Line" provides additional confirmation for momentum shifts. Crossovers between the main AMF line and its Signal Line can indicate potential changes in market direction.
Overbought/Oversold Levels:
Adjustable Overbought (default 70) and Oversold (default -70) levels visually highlight extreme momentum conditions.
These zones are enhanced with a color fill effect (bright red for overbought, bright cyan for oversold), making it easy to spot when the market is entering potentially exhausted states.
Crucially, these extreme zones can often be further validated by combining them with volatility bands (like Bollinger Bands or Keltner Channels as shown in the chart above) or other confluence indicators, offering stronger signals for potential reversals or exhaustion.
Benefits for Traders
Reduced Lag: DEMA's inherent design helps minimize lag compared to traditional moving averages, providing more timely signals.
Adaptive Intelligence: Automatically adjusts to market volatility, ensuring the indicator's sensitivity is appropriate for current conditions.
Holistic Momentum View: Combines price-based trend alignment with volume-based pressure for a more robust assessment of market flow.
Clear Visual Cues: Intuitive plots, signal line, and vibrant overbought/oversold zone fills make interpretation straightforward.
Customizable: Extensive input options allow traders to tailor the indicator to their specific trading style, asset, and timeframe.
How to Use
Trend Confirmation: Look for the AMF line and its Signal Line to align with the price trend.
Momentum Shifts: Crossovers between the AMF line and its Signal Line can indicate shifts in momentum.
Extreme Conditions: Pay attention when the AMF line enters the neon-highlighted overbought or oversold zones, signaling potential reversals or pauses in the current momentum. Always consider confirming these signals with other analysis tools, such as price action, chart patterns, support/resistance levels, or volatility indicators.
Customization: Experiment with the "Volatility Sensitivity," DEMA multipliers, and scoring weights to find the optimal settings for your trading strategy.

Stochastic RSI with Alerts# Stochastic RSI with Alerts - User Manual
## 1. Overview
This enhanced Stochastic RSI indicator identifies overbought/oversold conditions with visual signals and customizable alerts. It features:
- Dual-line Stoch RSI (K & D)
- Threshold-based buy/sell signals
- Configurable alert system
- Customizable parameters
## 2. Installation
1. Open TradingView chart
2. Open Pine Editor (📈 icon at bottom)
3. Copy/paste the full code
4. Click "Add to Chart"
## 3. Input Parameters
### 3.1 Core Settings
| Parameter | Default | Description |
|-----------|---------|-------------|
| K | 3 | Smoothing period for %K line |
| D | 3 | Smoothing period for %D line |
| RSI Length | 14 | RSI calculation period |
| Stochastic Length | 14 | Lookback period for Stoch calculation |
| RSI Source | Close | Price source for RSI calculation |
### 3.2 Signal Thresholds
| Parameter | Default | Description |
|-----------|---------|-------------|
| Upper Limit | 80 | Sell signal threshold (overbought) |
| Lower Limit | 20 | Buy signal threshold (oversold) |
### 3.3 Alert Settings
| Parameter | Default | Description |
|-----------|---------|-------------|
| Enable Buy Alerts | True | Toggle buy notifications |
| Enable Sell Alerts | True | Toggle sell notifications |
| Custom Alert Message | Empty | Additional text for alerts |
## 4. Signal Logic
### 4.1 Buy Signal (Green ▲)
Triggers when:
\text{%K crossover %D} \quad AND \quad (\text{%K ≤ Lower Limit} \quad OR \quad \text{%D ≤ Lower Limit})
### 4.2 Sell Signal (Red ▼)
Triggers when:
\text{%K crossunder %D} \quad AND \quad (\text{%K ≥ Upper Limit} \quad OR \quad \text{%D ≥ Upper Limit})
## 5. Alert System
### 5.1 Auto-Generated Alerts
The script automatically creates these alert conditions:
- **Buy Signal Alert**: Triggers on valid buy signals
- **Sell Signal Alert**: Triggers on valid sell signals
Alert messages include:
- Signal type (Buy/Sell)
- Current %K and %D values
- Custom message (if configured)
### 5.2 Alert Configuration
**Method 1: Script-Generated Alerts**
1. Hover over any signal marker
2. Click the 🔔 icon
3. Select trigger conditions:
- "Buy Signal Alert"
- "Sell Signal Alert"
**Method 2: Manual Setup**
1. Open Alert creation window
2. Condition: Select "Stoch RSI Alerts"
3. Choose:
- "Buy Signal Alert" for long entries
- "Sell Signal Alert" for exits/shorts
## 6. Customization Tips
### 6.1 Threshold Adjustment
// For day trading (tighter ranges)
upperLimit = 75
lowerLimit = 25
// For swing trading (wider ranges)
upperLimit = 85
lowerLimit = 15
### 6.2 Visual Modifications
Change signal markers via:
- `style=` : Try `shape.labelup`, `shape.flag`, etc.
- `color=` : Use hex codes (#FF00FF) or named colors
- `size=` : `size.tiny` to `size.huge`
## 7. Recommended Use Cases
1. **Mean Reversion Strategies**: Pair with support/resistance levels
2. **Trend Confirmation**: Filter with 200EMA direction
3. **Divergence Trading**: Compare with price action
## 8. Limitations
- Works best in ranging markets
- Combine with volume analysis for confirmation
- Not recommended as standalone strategy
---
This documentation follows technical writing best practices with:
- Clear parameter tables
- Mathematical signal logic
- Visual hierarchy
- Practical examples
- Usage recommendations

[blackcat] L2 Multi-Level Price Condition TrackerOVERVIEW
The L2 Multi-Level Price Condition Tracker represents an innovative approach to analyzing financial markets by simultaneously monitoring multiple price levels, thus providing traders with a holistic view of market dynamics. By combining dynamic calculations based on moving averages and price deviations, this tool aims to deliver precise and actionable insights into potential entry and exit points. It leverages sophisticated statistical measures to identify key thresholds that signify shifts in market sentiment, thereby aiding traders in making well-informed decisions. 🎯
Key benefits encompass:
• Comprehensive calculation of midpoints and average prices indicating short-term trend directions.
• Interactive visualization elements enhancing interpretability effortlessly.
• Real-time generation of buy/sell signals driven by precise condition evaluations.
TECHNICAL ANALYSIS COMPONENTS
📉 Midpoint Calculations:
Computes central reference points derived from high-low ranges establishing baseline supports/resistances.
Utilizes Simple Moving Averages (SMAs) along with standardized deviation formulas smoothing out volatility while preserving long-term trends accurately.
Facilitates identification of directional biases reflecting underlying market forces dynamically.
🕵️♂️ Advanced Price Level Detection:
Derives upper/lower bounds adjusting sensitivities adaptively responding to changing conditions flexibly.
Employs proprietary logic distinguishing between bullish/bearish sentiments promptly signaling transitions effectively.
Ensures consistent adherence to predefined statistical protocols maintaining accuracy robustly.
🎥 Dynamic Signal Generation:
Detects crossovers indicating dominance shifts between buyers/sellers promptly triggering timely alerts.
Integrates conditional logic reinforcing signal validity minimizing erroneous activations systematically.
Supports adaptive thresholds tuning sensitivities based on evolving market conditions flexibly accommodating varying scenarios.
INDICATOR FUNCTIONALITY
🔢 Core Algorithms:
Utilizes moving averages alongside standardized deviation formulas generating precise net volume measurements.
Implements Arithmetic Mean Line Algorithm (AMLA) smoothing techniques improving interpretability.
Ensures consistent alignment with established statistical principles preserving fidelity.
🖱️ User Interface Elements:
Dedicated plots displaying real-time midpoint markers facilitating swift decision-making.
Context-sensitive color coding distinguishing positive/negative deviations intuitively highlighting key activations clearly.
Background shading emphasizing proximity to crucial threshold activations enhancing visibility focusing attention on vital signals promptly.
STRATEGY IMPLEMENTATION
✅ Entry Conditions:
Confirm bullish/bearish setups validated through multiple confirmatory signals assessing concurrent market sentiment factors.
Validate entry decisions considering alignment between calculated midpoints and broader trend directions ensuring coherence.
Monitor cumulative breaches signifying potential trend reversals executing partial/total closes contingent upon predetermined loss limits preserving capital efficiently.
🚫 Exit Mechanisms:
Trigger exits upon hitting predefined thresholds derived from historical analyses promptly executing closures.
Execute partial/total closes contingent upon cumulative loss limits preserving capital efficiently managing exposures prudently.
Conduct periodic reviews gauging strategy effectiveness rigorously identifying areas needing refinement implementing corrective actions iteratively enhancing performance metrics steadily.
PARAMETER CONFIGURATIONS
🎯 Optimization Guidelines:
Lookback Period: Governs responsiveness versus stability balancing sensitivity/stability governing moving averages aligning with preferred granularity.
Price Source: Dictates primary data series driving volume calculations selecting relevant inputs accurately tailoring strategies accordingly.
💬 Customization Recommendations:
Commence with baseline defaults; iteratively refine parameters isolating individual impacts evaluating adjustments independently prior to combined modifications minimizing disruptions.
Prioritize minimizing erroneous trigger occurrences first optimizing signal fidelity sustaining balanced risk-reward profiles irrespective of chosen settings upholding disciplined approaches preserving capital efficiently.
ADVANCED RISK MANAGEMENT
🛡️ Proactive Risk Mitigation Techniques:
Enforce strict compliance with pre-defined maximum leverage constraints adhering strictly to guidelines managing exposures prudently.
Mandatorily apply trailing stop-loss orders conforming to script outputs enforcing discipline rigorously preventing adverse consequences.
Allocate positions proportionately relative to available capital reserves conducting periodic reviews gauging effectiveness continuously identifying improvement opportunities steadily.
⚠️ Potential Pitfalls & Solutions:
Address frequent violations arising during heightened volatility phases necessitating manual interventions judiciously preparing contingency plans proactively mitigating risks effectively.
Manage false alerts warranting immediate attention avoiding adverse consequences systematically implementing corrective actions reliably.
Prepare proactive responses amid adverse movements ensuring seamless functionality amidst fluctuating conditions fortifying resilience against anomalies robustly.
PERFORMANCE MONITORING METRICS
🔍 Evaluation Criteria:
Assess win percentages consistently across diverse trading instruments gauging reliability measuring profitability efficiency accurately evaluating downside risks comprehensively uncovering systematic biases potentially skewing outcomes.
Calculate average profit ratios per successful execution benchmarking actual vs expected performances documenting results meticulously tracking progress dynamically addressing identified shortcomings proactively fostering continuous improvements.
📈 Historical Data Analysis Tools:
Maintain detailed logs capturing every triggered event recording realized profits/losses comparing simulated projections accurately identifying discrepancies warranting investigation implementing iterative refinements steadily enhancing performance metrics progressively.
Identify recurrent systematic errors demanding corrective actions implementing iterative refinements steadily addressing identified shortcomings proactively fostering continuous enhancements dynamically improving robustness resiliently.
PROBLEM SOLVING ADVICE
🔧 Frequent Encountered Challenges:
Unpredictable behaviors emerging within thinly traded markets requiring filtration processes enhancing signal integrity excluding low-liquidity assets prone to erratic movements effectively.
Latency issues manifesting during abrupt price fluctuations causing missed opportunities introducing buffer intervals safeguarding major news/event impacts mitigating distortions seamlessly verifying reliable connections ensuring uninterrupted data flows guaranteeing accurate interpretations dependably.
💡 Effective Resolution Pathways:
Limit ongoing optimization attempts preventing model degradation maintaining optimal performance levels consistently recalibrating parameters periodically adapting strategies flexibly responding appropriately amidst varying conditions dynamically improving robustness resiliently.
Verify reliable connections ensuring uninterrupted data flows guaranteeing accurate interpretations dependably bolstering overall efficacy systematically addressing identified shortcomings dynamically fostering continuous advancements.
THANKS
Heartfelt acknowledgment extends to all developers contributing invaluable insights regarding multi-level price condition-based trading methodologies! ✨

Multi-Indicator Swing [TIAMATCRYPTO]v6# Strategy Description:
## Multi-Indicator Swing
This strategy is designed for swing trading across various markets by combining multiple technical indicators to identify high-probability trading opportunities. The system focuses on trend strength confirmation and volume analysis to generate precise entry and exit signals.
### Core Components:
- **Supertrend Indicator**: Acts as the primary trend direction filter with optimized settings (Factor: 3.0, ATR Period: 10) to balance responsiveness and reliability.
- **ADX (Average Directional Index)**: Confirms the strength of the prevailing trend, filtering out sideways or choppy market conditions where the strategy avoids taking positions.
- **Liquidity Delta**: A volume-based indicator that analyzes buying and selling pressure imbalances to validate trend direction and potential reversals.
- **PSAR (Optional)**: Can be enabled to add additional confirmation for trend changes, turned off by default to reduce signal filtering.
### Key Features:
- **Flexible Direction Trading**: Choose between long-only, short-only, or bidirectional trading to adapt to market conditions or account restrictions.
- **Conservative Risk Management**: Implements fixed percentage-based stop losses (default 2%) and take profits (default 4%) for a positive risk-reward ratio.
- **Realistic Backtesting Parameters**: Includes commission (0.1%) and slippage (2 points) to reflect real-world trading conditions.
- **Visual Signals**: Clear buy/sell arrows with customizable sizes for easy identification on the chart.
- **Information Panel**: Dynamic display showing active indicators and current risk settings.
### Best Used On:
Daily timeframes for cryptocurrencies, forex, or stock indices. The strategy performs optimally on assets with clear trending behavior and sufficient volatility.
### Default Settings:
Optimized for conservative position sizing (5% of equity per trade) with an initial capital of $10,000. The backtesting period (2021-2023) provides a statistically significant sample of varied market conditions.

[blackcat] L1 Swing Reversal IndexOVERVIEW
The indicator is crafted to assist traders in identifying potential swing reversal points within various markets 📈✨. This sophisticated tool combines elements from price deviations, smoothed moving averages, and relative strength indices (RSIs) to generate actionable trade signals, making it easier for users to spot lucrative entry/exit opportunities. By visualizing key market conditions through customizable plots and labels, this indicator simplifies complex analyses into straightforward decisions.
Ideal for day traders or swing traders looking to capitalize on short-to-medium-term trends, the offers invaluable insights into market sentiment changes enabling precise timing of trades.
FEATURES
Dynamic Price Deviation Calculation: Computes adaptive price deviations considering both typical prices and volatility metrics.
Smoothed Deviations: Utilizes dual-smoothing techniques ensuring accurate reflection of underlying trends without excessive noise interference.
Enhanced RSI Integration: Includes a modified version of Relative Strength Index providing clearer overbought/oversold conditions.
Visual Signal Representation:
Colored columns indicating bullish/bearish pressure levels directly on the chart.
Dynamic labels marking specific buy/sell conditions enhancing clarity.
Customizable Parameters: Allows tweaking smoothing, volatility, and RSI periods according to user preferences facilitating tailored usage.
Alert Notifications: Supports real-time alerts via TradingView’s integrated system keeping traders informed promptly ✅🔔.
HOW TO USE
Script Setup:
Save the provided code under Indicators > Add Custom Indicator in your TradingView workspace.
Name appropriately and activate across desired charts.
Parameter Adjustments:
Configure Smoothing, Volatility, and RSI periods based on preferred trading styles or asset characteristics:
Shorter durations suit fast-paced environments while longer ones align better with slower-moving assets.
Experiment iteratively optimizing settings maximizing accuracy for specific needs.
Interpreting Plots/Labels:
Observe colored columns representing current market sentiment:
Green columns signify bullish momentum suggesting possible buying opportunities.
Red columns indicate bearish tendencies hinting at selling chances.
Note dynamic "BUY" & "SELL" labels triggered under predefined criteria guiding timely actions.
Incorporating Signals:
Integrate these generated cues within broader strategies leveraging support/resistance lines, volume data, etc., ensuring robust validation before executing trades.
Cross-reference alongside other complementary tools (e.g., MACD, Bollinger Bands) for added confirmation bolstering decision-making confidence.
Setting Up Alerts:
Enable alert notifications corresponding to crucial conditions ensuring timely updates via TradingView’s notification infrastructure.
Fine-tune alert messages reflecting personal requirements maintaining seamless workflow integration.
Testing & Validation:
Conduct thorough backtesting employing historical datasets verifying effectiveness amidst varying market scenarios.
Continuously refine parameter configurations enhancing overall performance mitigating false positives/negatives.
EXAMPLE SCENARIOS
Short-Term Trades: Capitalize on fleeting reversals by focusing primarily on shorter-period RSIs combined with swift price deviation movements.
Swing Strategies: Utilize medium-range settings identifying intermediate trend shifts maximizing profit potentials while minimizing risks.
LIMITATIONS
Accuracy relies heavily upon correctly configured inputs; hence regular re-evaluation aligning evolving dynamics proves imperative.
Excessive dependence solely on this metric might lead to missed opportunities during sideways/choppy phases necessitating additional confirmatory indicators.
Always complement outputs with fundamental analyses securing comprehensive perspectives effectively managing associated risks.
NOTES
Educational Insights: Gain deeper understanding exploring underlying principles behind price deviations and their role in technical analysis fostering better comprehension.
Risk Management Protocols: Employ strict risk management practices encompassing stop-loss/profit targets preserving capital integrity amid unpredictable market fluctuations.
Continuous Learning: Stay abreast exploring emerging financial landscapes incorporating innovative methodologies augmenting script utility and relevance.
THANKS
Thanks go out to everyone contributing towards refining and improving this script. Your valuable feedback fuels ongoing enhancements propelling superior trading experiences!

ADX Forecast [Titans_Invest]ADX Forecast
This isn’t just another ADX indicator — it’s the most powerful and complete ADX tool ever created, and without question the best ADX indicator on TradingView, possibly even the best in the world.
ADX Forecast represents a revolutionary leap in trend strength analysis, blending the timeless principles of the classic ADX with cutting-edge predictive modeling. For the first time on TradingView, you can anticipate future ADX movements using scientifically validated linear regression — a true game-changer for traders looking to stay ahead of trend shifts.
1. Real-Time ADX Forecasting
By applying least squares linear regression, ADX Forecast projects the future trajectory of the ADX with exceptional accuracy. This forecasting power enables traders to anticipate changes in trend strength before they fully unfold — a vital edge in fast-moving markets.
2. Unmatched Customization & Precision
With 26 long entry conditions and 26 short entry conditions, this indicator accounts for every possible ADX scenario. Every parameter is fully customizable, making it adaptable to any trading strategy — from scalping to swing trading to long-term investing.
3. Transparency & Advanced Visualization
Visualize internal ADX dynamics in real time with interactive tags, smart flags, and fully adjustable threshold levels. Every signal is transparent, logic-based, and engineered to fit seamlessly into professional-grade trading systems.
4. Scientific Foundation, Elite Execution
Grounded in statistical precision and machine learning principles, ADX Forecast upgrades the classic ADX from a reactive lagging tool into a forward-looking trend prediction engine. This isn’t just an indicator — it’s a scientific evolution in trend analysis.
⯁ SCIENTIFIC BASIS LINEAR REGRESSION
Linear Regression is a fundamental method of statistics and machine learning, used to model the relationship between a dependent variable y and one or more independent variables 𝑥.
The general formula for a simple linear regression is given by:
y = β₀ + β₁x + ε
β₁ = Σ((xᵢ - x̄)(yᵢ - ȳ)) / Σ((xᵢ - x̄)²)
β₀ = ȳ - β₁x̄
Where:
y = is the predicted variable (e.g. future value of RSI)
x = is the explanatory variable (e.g. time or bar index)
β0 = is the intercept (value of 𝑦 when 𝑥 = 0)
𝛽1 = is the slope of the line (rate of change)
ε = is the random error term
The goal is to estimate the coefficients 𝛽0 and 𝛽1 so as to minimize the sum of the squared errors — the so-called Random Error Method Least Squares.
⯁ LEAST SQUARES ESTIMATION
To minimize the error between predicted and observed values, we use the following formulas:
β₁ = /
β₀ = ȳ - β₁x̄
Where:
∑ = sum
x̄ = mean of x
ȳ = mean of y
x_i, y_i = individual values of the variables.
Where:
x_i and y_i are the means of the independent and dependent variables, respectively.
i ranges from 1 to n, the number of observations.
These equations guarantee the best linear unbiased estimator, according to the Gauss-Markov theorem, assuming homoscedasticity and linearity.
⯁ LINEAR REGRESSION IN MACHINE LEARNING
Linear regression is one of the cornerstones of supervised learning. Its simplicity and ability to generate accurate quantitative predictions make it essential in AI systems, predictive algorithms, time series analysis, and automated trading strategies.
By applying this model to the ADX, you are literally putting artificial intelligence at the heart of a classic indicator, bringing a new dimension to technical analysis.
⯁ VISUAL INTERPRETATION
Imagine an ADX time series like this:
Time →
ADX →
The regression line will smooth these values and extend them n periods into the future, creating a predicted trajectory based on the historical moment. This line becomes the predicted ADX, which can be crossed with the actual ADX to generate more intelligent signals.
⯁ SUMMARY OF SCIENTIFIC CONCEPTS USED
Linear Regression Models the relationship between variables using a straight line.
Least Squares Minimizes the sum of squared errors between prediction and reality.
Time Series Forecasting Estimates future values based on historical data.
Supervised Learning Trains models to predict outputs from known inputs.
Statistical Smoothing Reduces noise and reveals underlying trends.
⯁ WHY THIS INDICATOR IS REVOLUTIONARY
Scientifically-based: Based on statistical theory and mathematical inference.
Unprecedented: First public ADX with least squares predictive modeling.
Intelligent: Built with machine learning logic.
Practical: Generates forward-thinking signals.
Customizable: Flexible for any trading strategy.
⯁ CONCLUSION
By combining ADX with linear regression, this indicator allows a trader to predict market momentum, not just follow it.
ADX Forecast is not just an indicator — it is a scientific breakthrough in technical analysis technology.
⯁ Example of simple linear regression, which has one independent variable:
⯁ In linear regression, observations ( red ) are considered to be the result of random deviations ( green ) from an underlying relationship ( blue ) between a dependent variable ( y ) and an independent variable ( x ).
⯁ Visualizing heteroscedasticity in a scatterplot against 100 random fitted values using Matlab:
⯁ The data sets in the Anscombe's quartet are designed to have approximately the same linear regression line (as well as nearly identical means, standard deviations, and correlations) but are graphically very different. This illustrates the pitfalls of relying solely on a fitted model to understand the relationship between variables.
⯁ The result of fitting a set of data points with a quadratic function:
_______________________________________________________________________
🥇 This is the world’s first ADX indicator with: Linear Regression for Forecasting 🥇_______________________________________________________________________
_________________________________________________
🔮 Linear Regression: PineScript Technical Parameters 🔮
_________________________________________________
Forecast Types:
• Flat: Assumes prices will remain the same.
• Linreg: Makes a 'Linear Regression' forecast for n periods.
Technical Information:
ta.linreg (built-in function)
Linear regression curve. A line that best fits the specified prices over a user-defined time period. It is calculated using the least squares method. The result of this function is calculated using the formula: linreg = intercept + slope * (length - 1 - offset), where intercept and slope are the values calculated using the least squares method on the source series.
Syntax:
• Function: ta.linreg()
Parameters:
• source: Source price series.
• length: Number of bars (period).
• offset: Offset.
• return: Linear regression curve.
This function has been cleverly applied to the RSI, making it capable of projecting future values based on past statistical trends.
______________________________________________________
______________________________________________________
⯁ WHAT IS THE ADX❓
The Average Directional Index (ADX) is a technical analysis indicator developed by J. Welles Wilder. It measures the strength of a trend in a market, regardless of whether the trend is up or down.
The ADX is an integral part of the Directional Movement System, which also includes the Plus Directional Indicator (+DI) and the Minus Directional Indicator (-DI). By combining these components, the ADX provides a comprehensive view of market trend strength.
⯁ HOW TO USE THE ADX❓
The ADX is calculated based on the moving average of the price range expansion over a specified period (usually 14 periods). It is plotted on a scale from 0 to 100 and has three main zones:
• Strong Trend: When the ADX is above 25, indicating a strong trend.
• Weak Trend: When the ADX is below 20, indicating a weak or non-existent trend.
• Neutral Zone: Between 20 and 25, where the trend strength is unclear.
______________________________________________________
______________________________________________________
⯁ ENTRY CONDITIONS
The conditions below are fully flexible and allow for complete customization of the signal.
______________________________________________________
______________________________________________________
🔹 CONDITIONS TO BUY 📈
______________________________________________________
• Signal Validity: The signal will remain valid for X bars .
• Signal Sequence: Configurable as AND or OR .
🔹 +DI > -DI
🔹 +DI < -DI
🔹 +DI > ADX
🔹 +DI < ADX
🔹 -DI > ADX
🔹 -DI < ADX
🔹 ADX > Threshold
🔹 ADX < Threshold
🔹 +DI > Threshold
🔹 +DI < Threshold
🔹 -DI > Threshold
🔹 -DI < Threshold
🔹 +DI (Crossover) -DI
🔹 +DI (Crossunder) -DI
🔹 +DI (Crossover) ADX
🔹 +DI (Crossunder) ADX
🔹 +DI (Crossover) Threshold
🔹 +DI (Crossunder) Threshold
🔹 -DI (Crossover) ADX
🔹 -DI (Crossunder) ADX
🔹 -DI (Crossover) Threshold
🔹 -DI (Crossunder) Threshold
🔮 +DI (Crossover) -DI Forecast
🔮 +DI (Crossunder) -DI Forecast
🔮 ADX (Crossover) +DI Forecast
🔮 ADX (Crossunder) +DI Forecast
______________________________________________________
______________________________________________________
🔸 CONDITIONS TO SELL 📉
______________________________________________________
• Signal Validity: The signal will remain valid for X bars .
• Signal Sequence: Configurable as AND or OR .
🔸 +DI > -DI
🔸 +DI < -DI
🔸 +DI > ADX
🔸 +DI < ADX
🔸 -DI > ADX
🔸 -DI < ADX
🔸 ADX > Threshold
🔸 ADX < Threshold
🔸 +DI > Threshold
🔸 +DI < Threshold
🔸 -DI > Threshold
🔸 -DI < Threshold
🔸 +DI (Crossover) -DI
🔸 +DI (Crossunder) -DI
🔸 +DI (Crossover) ADX
🔸 +DI (Crossunder) ADX
🔸 +DI (Crossover) Threshold
🔸 +DI (Crossunder) Threshold
🔸 -DI (Crossover) ADX
🔸 -DI (Crossunder) ADX
🔸 -DI (Crossover) Threshold
🔸 -DI (Crossunder) Threshold
🔮 +DI (Crossover) -DI Forecast
🔮 +DI (Crossunder) -DI Forecast
🔮 ADX (Crossover) +DI Forecast
🔮 ADX (Crossunder) +DI Forecast
______________________________________________________
______________________________________________________
🤖 AUTOMATION 🤖
• You can automate the BUY and SELL signals of this indicator.
______________________________________________________
______________________________________________________
⯁ UNIQUE FEATURES
______________________________________________________
Linear Regression: (Forecast)
Signal Validity: The signal will remain valid for X bars
Signal Sequence: Configurable as AND/OR
Condition Table: BUY/SELL
Condition Labels: BUY/SELL
Plot Labels in the Graph Above: BUY/SELL
Automate and Monitor Signals/Alerts: BUY/SELL
Linear Regression (Forecast)
Signal Validity: The signal will remain valid for X bars
Signal Sequence: Configurable as AND/OR
Table of Conditions: BUY/SELL
Conditions Label: BUY/SELL
Plot Labels in the graph above: BUY/SELL
Automate & Monitor Signals/Alerts: BUY/SELL
______________________________________________________
📜 SCRIPT : ADX Forecast
🎴 Art by : @Titans_Invest & @DiFlip
👨💻 Dev by : @Titans_Invest & @DiFlip
🎑 Titans Invest — The Wizards Without Gloves 🧤
✨ Enjoy!
______________________________________________________
o Mission 🗺
• Inspire Traders to manifest Magic in the Market.
o Vision 𐓏
• To elevate collective Energy 𐓷𐓏
